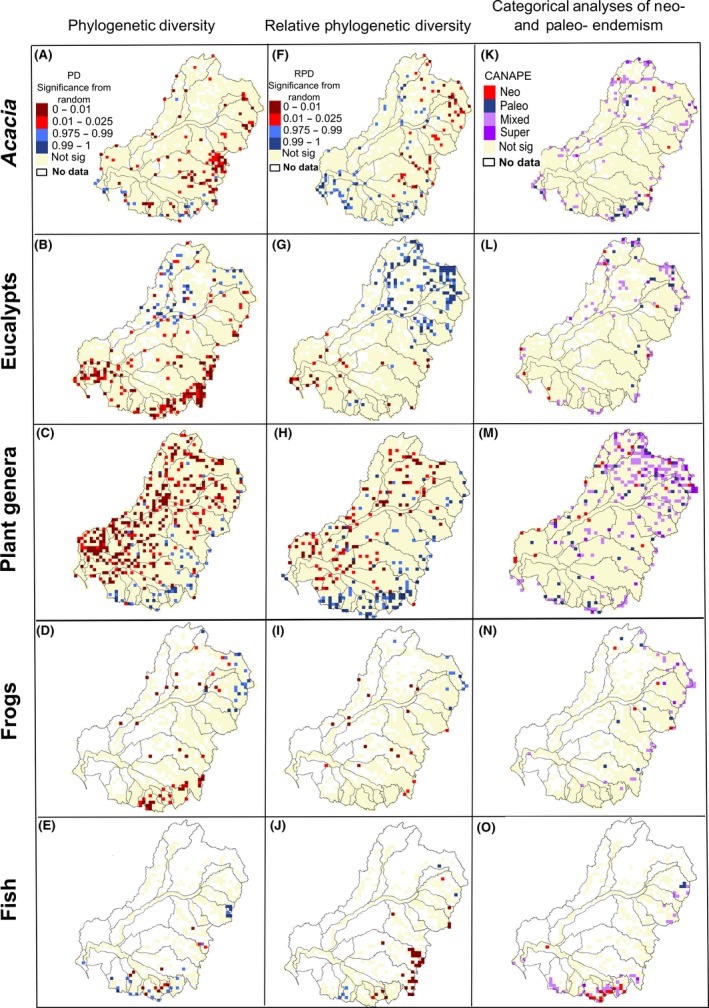
Figure 3.

Centers of significantly high and low phylogenetic diversity (A–E), significantly high and low relative phylogenetic diversity (F–J), and centers of endemism identified by categorical analysis of neo‐ and paleo‐endemism (CANAPE; Mishler et al. 2014) (K–O) for all five taxonomic groups.
