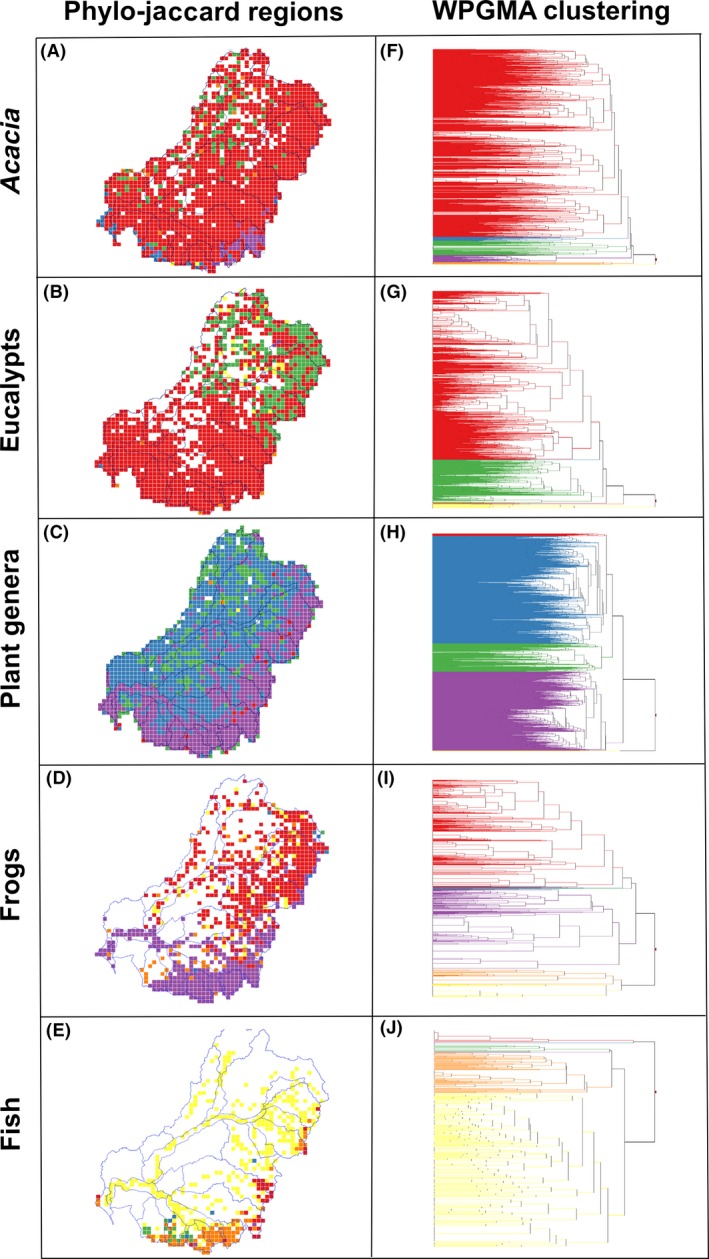
Figure 5.

Phylogenetic beta‐diversity analyses of individual taxonomic groups in the MDB, southeastern Australia. The major phylo‐jaccard clusters are colored on the map (A–E) and dendrograms (F–J). These dendrograms show the similarity between grid cells in the portion of the phylogeny they share.
