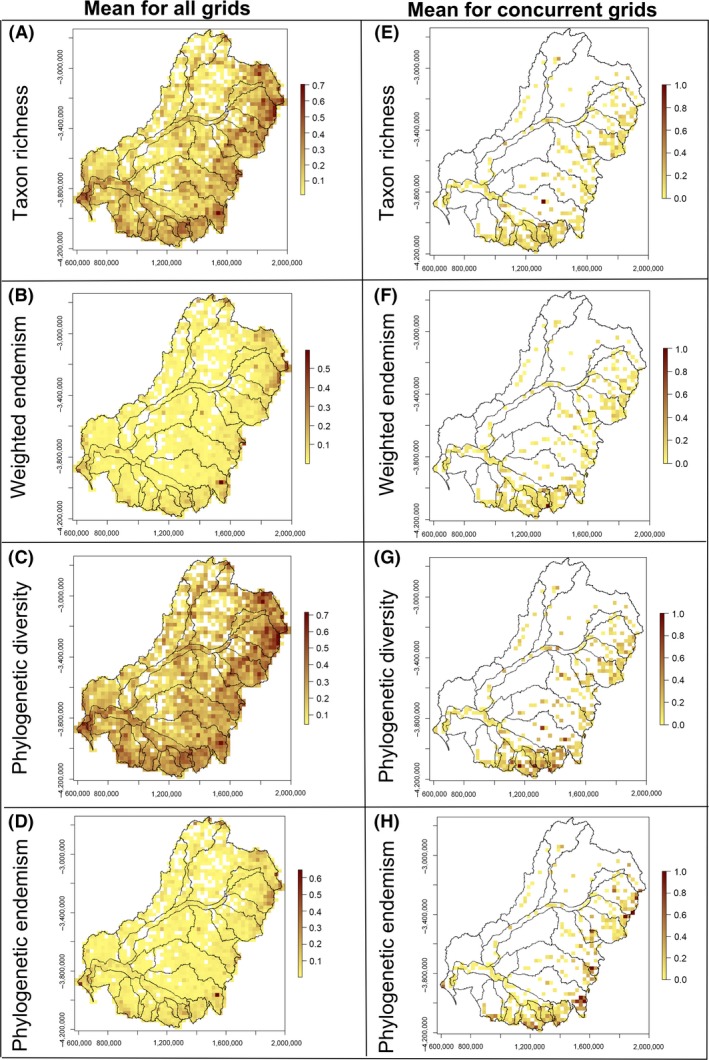
Figure 6.

Maps comparing diversity and endemism across five taxonomic groups in the MDB, southeastern Australia, calculated using two spatial approaches: mean for all grids (left column) and mean for concordant grid cells (i.e., the mean for only those cells with all 5 groups present; right column). The different diversity metrics are as follows: taxon richness (A–E), weighted endemism (B–F), phylogenetic diversity (C–G), and phylogenetic endemism (D–H).
