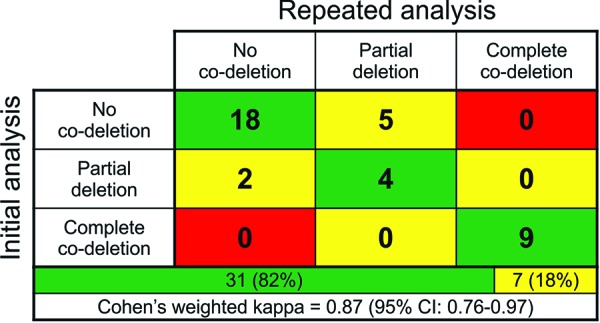
Figure 4. Confrontation of the results of both analyses (initial analysis in rows, repeated analysis in columns). Concordance was marked as green, partial discordance as yellow and discordance as red. Bottom rows show the proportions between concordant and partially discordant cases and κ-statistics. Cohen’s weighted κ-statistics was calculated using the order as in the table: no-codeletion (0), partial co-deletion (1), complete co-deletion (2).

