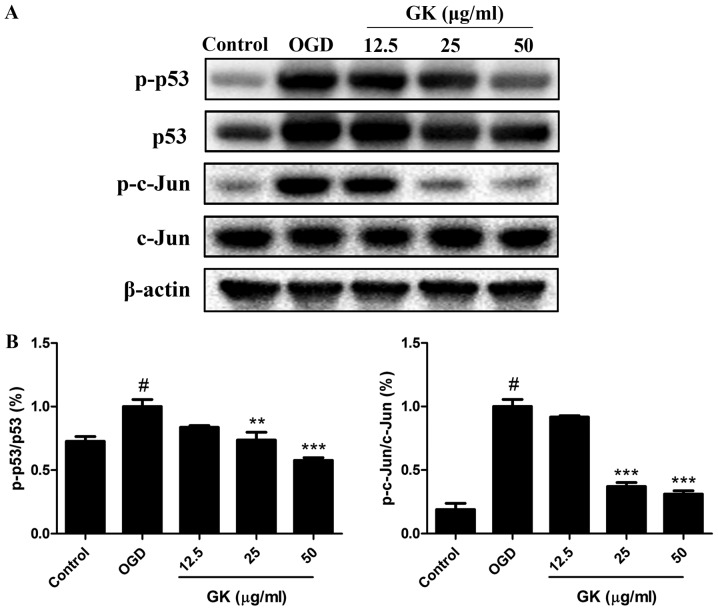
Figure 5.
Suppression of the transcription factor activity of p53 and c-Jun with GK treatment in OGD-induced SH-SY5Y cells. (A) Western blot analysis of the protein expression levels of p-p53, p53, p-c-Jun and c-Jun in SH-SY5Y cells with different concentrations of GK treatment (12.5, 25 and 50 µg/ml) and reoxygenation for 1 h. (B) Quantity one software was used for quantitative analysis of p-p53/p53 and p-c-Jun/c-Jun. The results present averages of three independent experiments (mean ± SD). #P<0.05 vs. control group, **P<0.01 and ***P<0.001 vs. OGD group. GK, ginkgolide K; OGD, oxygen-glucose deprivation.

