
Figure 1.
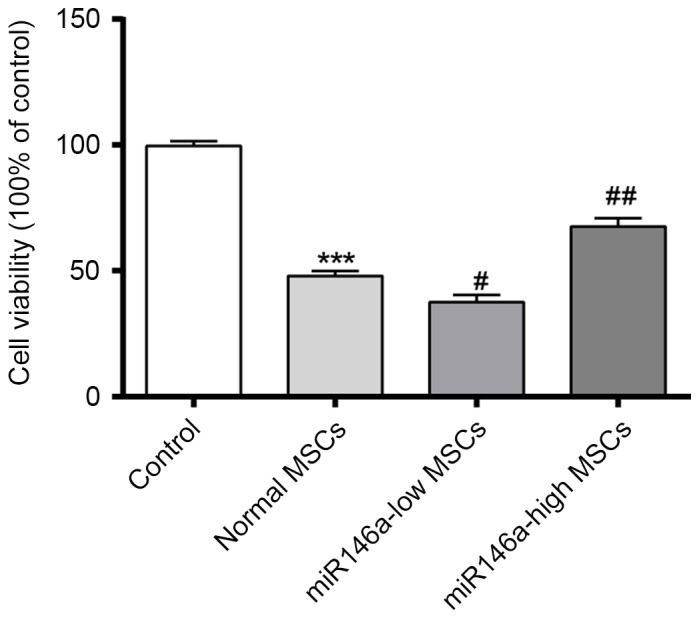
Expression levels of miR146a in each group on the effect of cell viability of MSCs. ***P<0.001 vs. Control; #P<0.05 vs. Normal MSCs; ##P<0.01 vs. Normal MSCs. miR146a, microRNA 146a; MSC, mesenchymal stem cell.
Official websites use .gov
A
.gov website belongs to an official
government organization in the United States.
Secure .gov websites use HTTPS
A lock (
) or https:// means you've safely
connected to the .gov website. Share sensitive
information only on official, secure websites.
Expression levels of miR146a in each group on the effect of cell viability of MSCs. ***P<0.001 vs. Control; #P<0.05 vs. Normal MSCs; ##P<0.01 vs. Normal MSCs. miR146a, microRNA 146a; MSC, mesenchymal stem cell.