Figure 1.
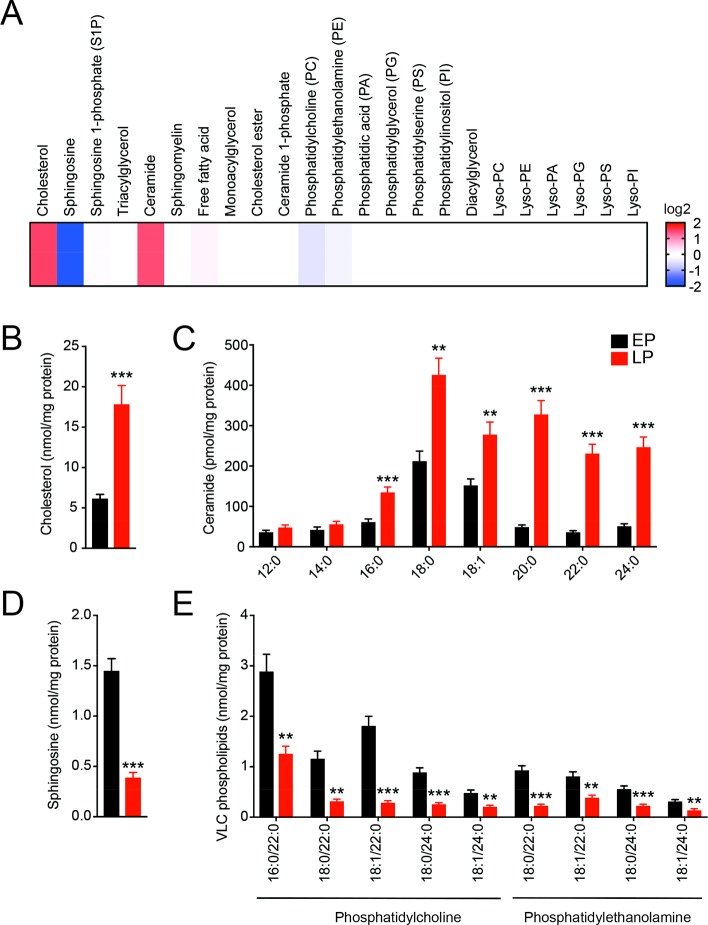
Lipidomic characterization of EPs and LPs derived from RAW264.7 mouse macrophages. (A) Heat map plot showing the different lipid classes assessed by comparative LC-MS/MS analysis for EPs and LPs from RAW264.7 mouse macrophages. The heat map plot represents an average of fold changes (LP/EP) on a log 2 scale for different lipids from a particular lipid class. Blue and red color changes show enrichment of a particular lipid class on EP and LP respectively. Data represent six biological replicates per group. See Supporting Information Table 1 for complete data sets. Concentration of (B) cholesterol, (C) ceramides, (D) sphingosine, and (E) very long chain (VLC) containing phosphatidylcholine (PC) and phosphatidylethanolamine (PE) phospholipids from EPs and LPs. **P < 0.01, ***P < 0.001 for LP group versus EP group by Student's t test.

