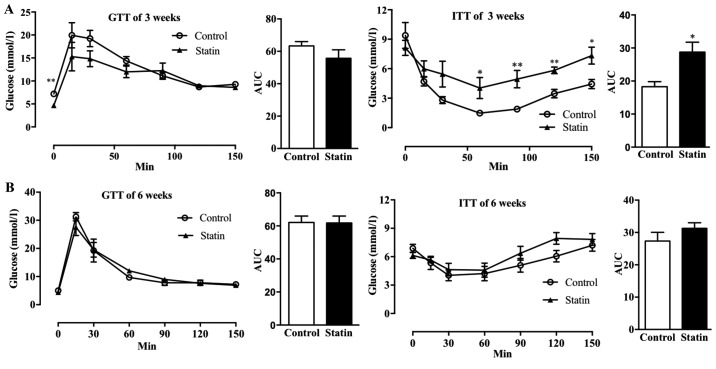
Figure 1.
Effects of 3 and 6 weeks of treatment with atorvastatin on glucose homeostasis in C57BL/6j mice. GTT (AUC of GTT, left) and ITT (AUC of ITT; right) were performed following (A) 3 weeks and (B) 6 weeks of treatment with atorvastatin. n=6/group. Data are expressed as the mean ± standard error. *P<0.05, *P<0.01 vs. respective control. GTT, glucose tolerance tests; AUC, area under the curve; ITT, insulin tolerance tests.

