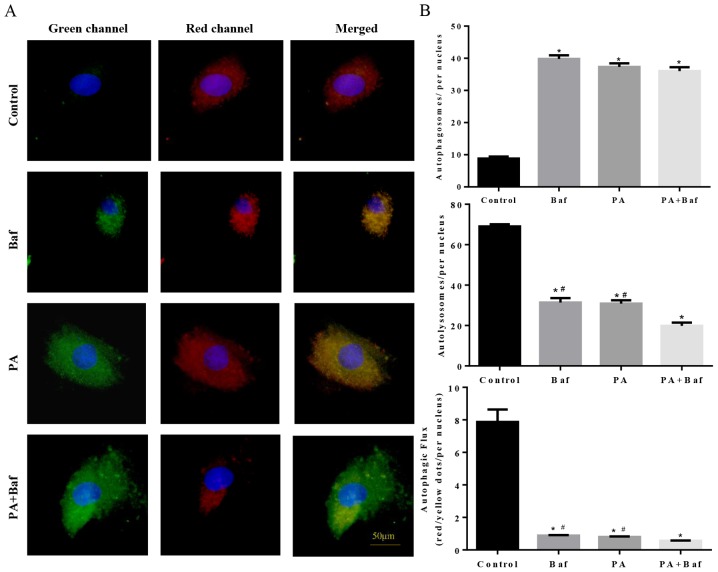
Figure 6.
Transfection of the mCherry-GFP-LC3 plasmid into H9C2 cells and quantification of the autophagic puncta by confocal microscopy. (A) H9C2 cells were cultured under normal conditions (Control), in the presence of Baf A1 (Baf), palmitate (PA) and the two combined (Baf+PA). Representative epifluorescence images (×400) demonstrated the cellular localization of mCherry-GFP-LC3 in the H9C2 cells. (B) The mean number of autophagosomes and autolysosomes are represented by yellow and red dots, respectively, in the merged images. The results represent the means from at least three independent experiments and at least six cells in each group were counted. The results are presented as the mean ± the standard error of the mean. *P<0.05 vs. control and #P<0.05 vs. PA+Baf by post-hoc test. PA, palmitate; Baf, bafilomycin A1; GFP, green fluorescent protein.

