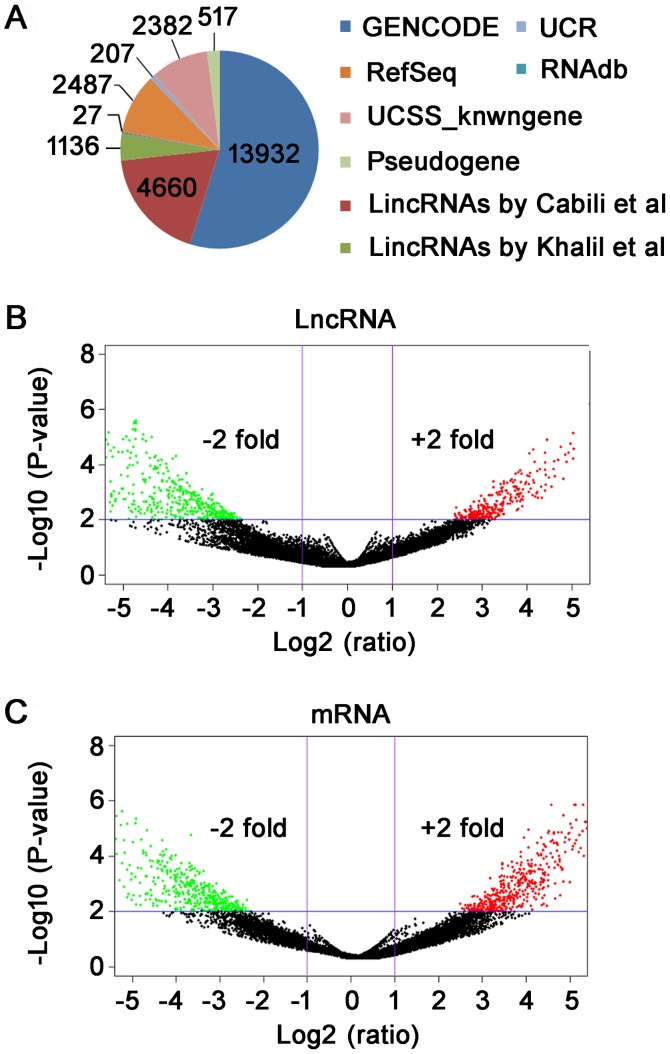
Figure 1.
Differential expression of lncRNAs between TAD and NTA by microarray analysis. (A) A pie chart presenting the relative numbers of lncRNAs from the majority of authoritative databases. Volcano plots were constructed using fold-change and P-values to present the distribution of (B) lncRNAs and (C) mRNAs, respectively. The vertical lines represent P<0.05 differences, and the horizontal lines correspond to 2.0-fold up and down. The red and green points in the plot represent the differentially expressed genes with statistical significance. TAD, thoracic aortic dissection; NTA, normal thoracic aorta, LncRNA, long non-coding RNA.

