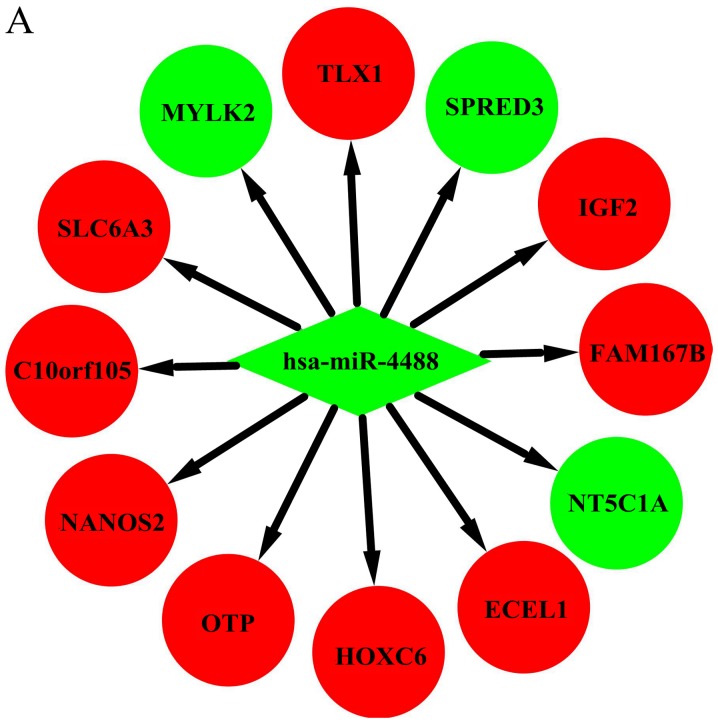
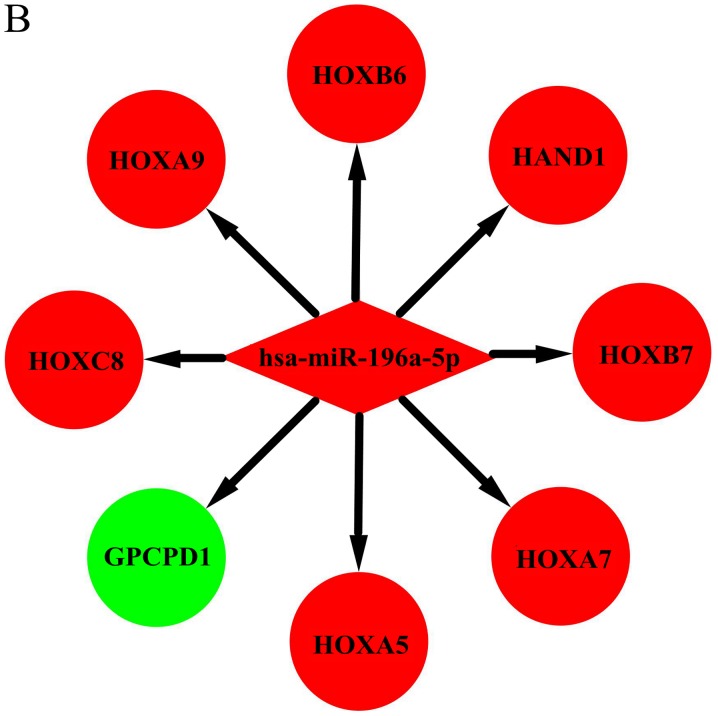
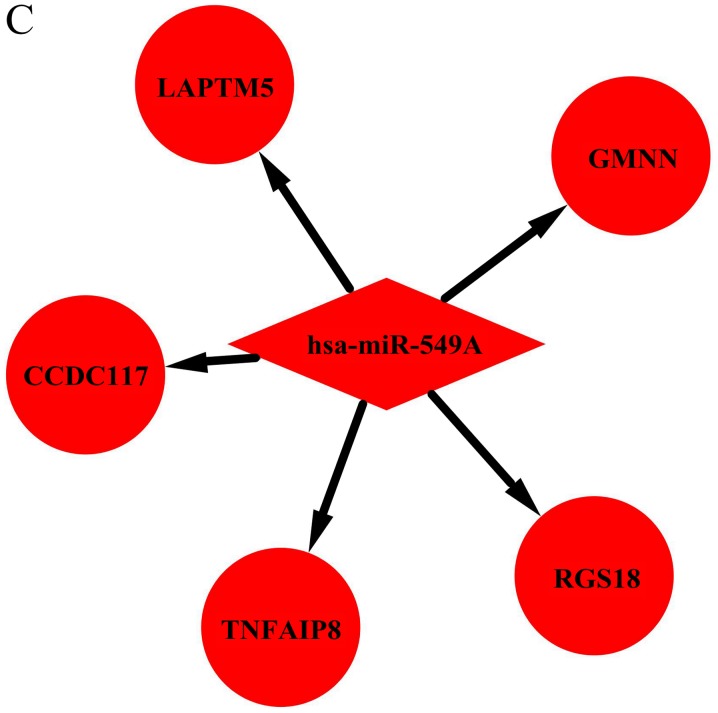
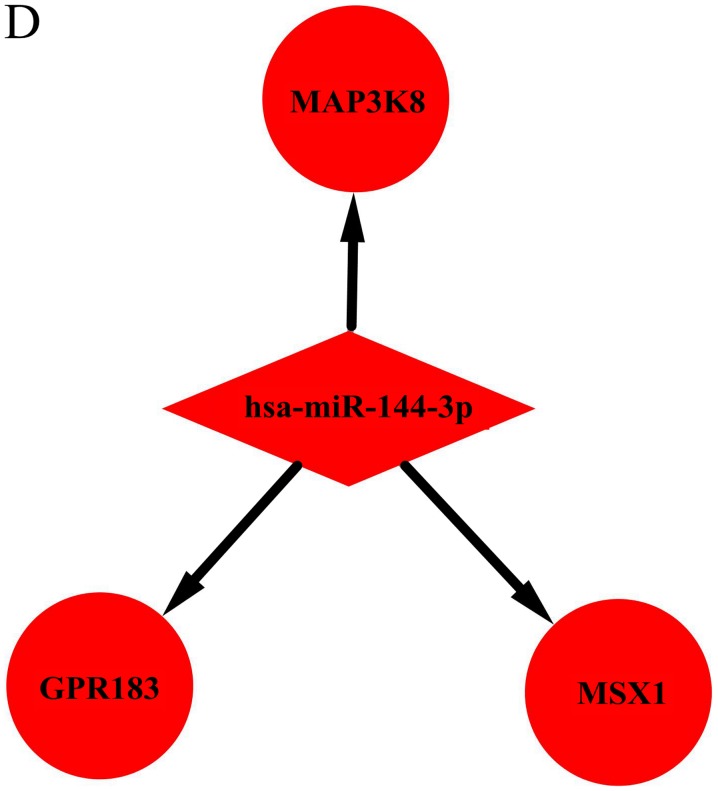
Figure 4.
Interaction network of DEMs and target genes in HD. Interaction networks for (A) hsa-miR-4488, (B) hsa-miR-196a-5p, (C) hsa-miR-459A, The red and green colors represent upregulation and downregulation, respectively. Interaction network of DEMs and target genes in HD. (D) hsa-miR-144-3p, (E) hsa-miR-10b-3p, (F) hsa-miR-10a-5p and (G) hsa-miR-483-5p. The red and green colors represent upregulation and downregulation, respectively.


