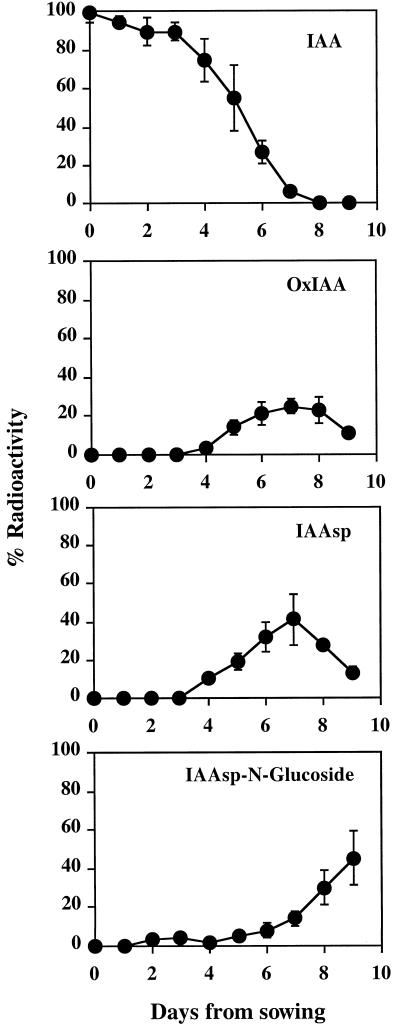
Figure 8.
Relative IAA catabolism, measured as the amount of radioactivity in each compound after 24 h of incubation with [1-14C]IAA. Data presented as the percentage of radioactivity relative to total initially added. Vertical bars represent sd. IAA-N-glucoside was present in such low quantities that data for this compound are not presented in this figure.

