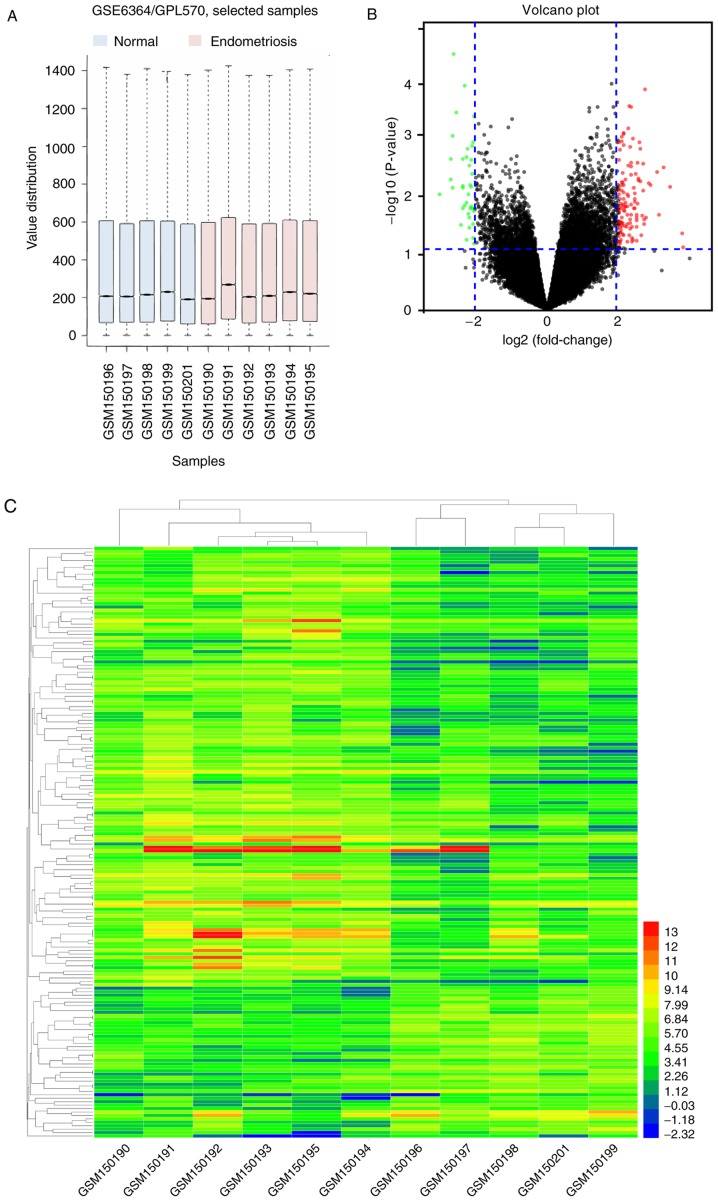
Figure 1.
Overview of GSE6364 and identification of common DEGs. (A) Box plot graph of value distribution of GSE6364. (B) Cutoff values and volcano plot displaying the DEGs. Red indicates upregulated genes and green indicates downregulated genes. (C) Hierarchical clustering and heat map of the DEGs in GSE6364. GSM150190-150195: Patients with endometriosis; GSM150196-150201: Normal samples. C-X-C motif chemokine receptor 2; DEG, differentially expression genes; GSEA, Gene Set Enrichment Analysis.

