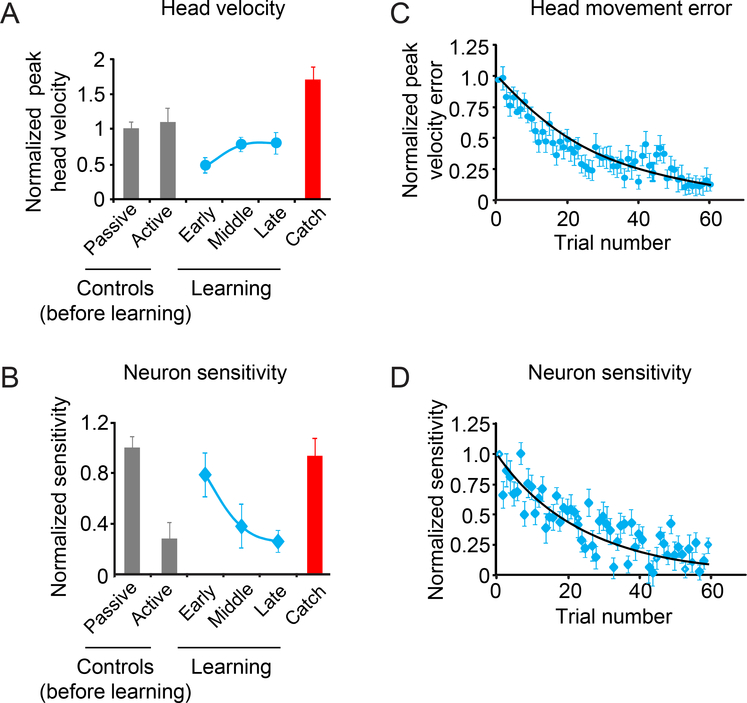
Figure 3:
Average head velocity and sensitivity for our population of rFN neurons during the learning phase. A. Normalized head velocity for control trials before learning, learning phase and catch trials. B. Normalized neuronal sensitivity for control trials, the learning phase and catch trials. Data show average and error bars are ±SEM. C. Scatter plot of peak head velocity errors over time for each trial during the learning phase. D. Scatter plot of normalized neuronal sensitivity over time for each trial during the learning phase. Black lines show exponential fits to the data.

