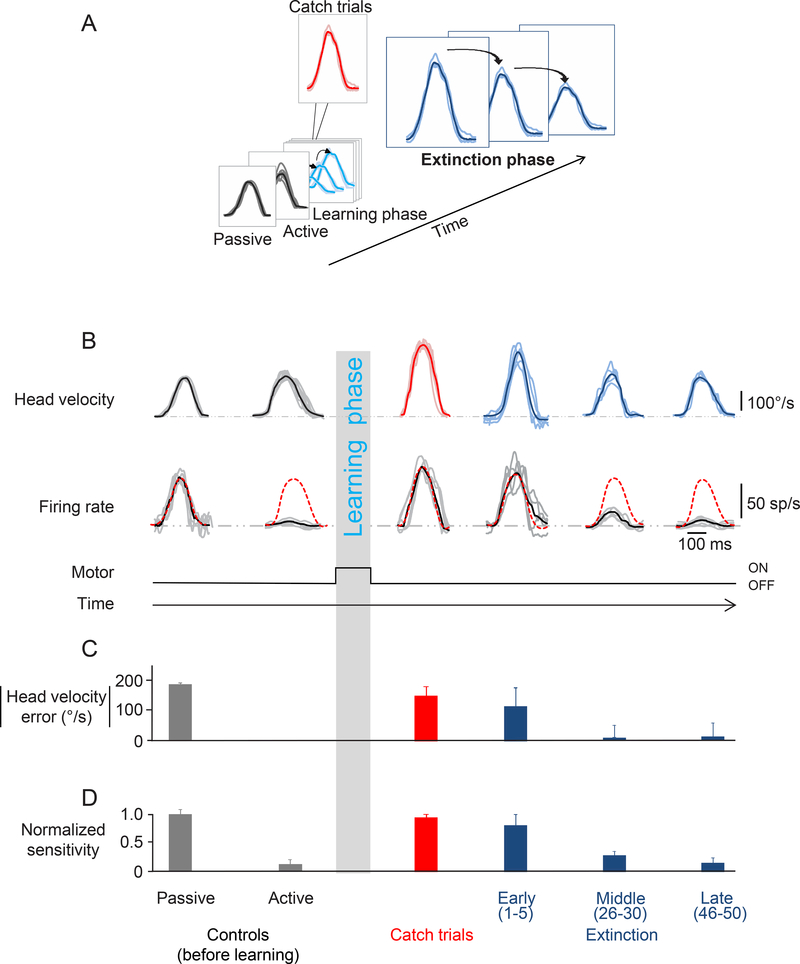
Figure 4:
Extinction phase. A. This figure focuses on the last phase of the paradigm during which the torque motor is turned off (extinction phase). B. Activity of the same example neuron as in Figure 2 during the extinction phase. Top row shows the head velocity during the extinction phase overlaying a minimum of 5 trials. Second row shows the firing rates corresponding to the head movements above. Grey lines show individual trials and black lines show the average. The dashed red lines superimposed on the firing rates are a prediction based on the sensitivity estimated during passively-applied whole body rotation. C. Head velocity error magnitude during learning extinction. When the load was removed, the monkey initially made faster head movements, and then head velocity error progressively decreased as head velocity approached control values (dark blue bars). D. Normalized neuronal sensitivity for the extinction phase. Data show average and error bars are ±SEM. Data from the control (before learning) and catch trials are reproduced here for comparison.

