
Figure 9.
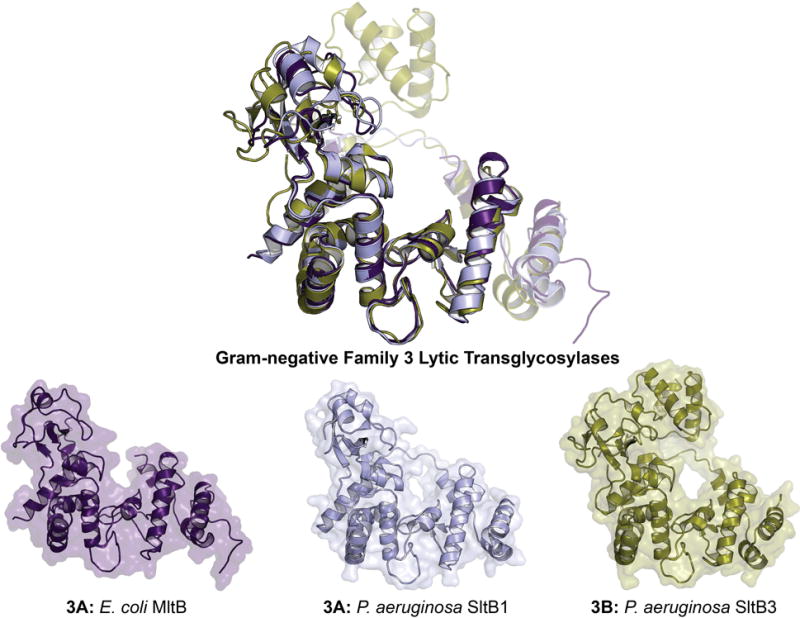
X-ray structure alignment of Gram-negative Family 3 LTs, displaying the conservation of the Slt_2 domain (Pfam: PF13406). The ribbon representation of each apo LT crystal structure is displayed below with a transparent surface representation. A color version of this figure is available at www.tandfonline.com/ibmg.