
Figure 2.
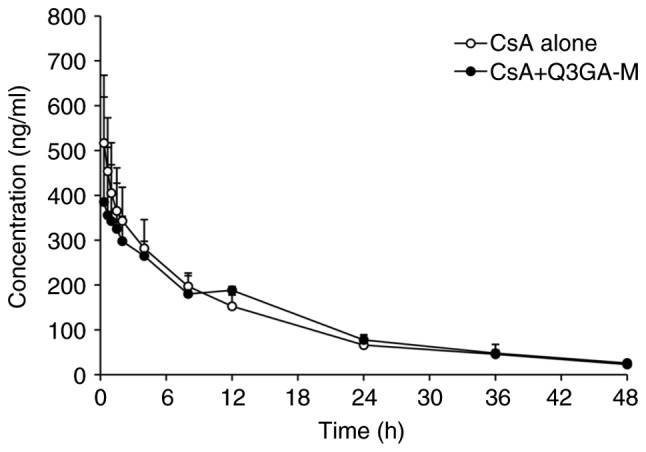
Mean blood concentration-time curves of CsA following intravenous injection of 2.5 mg/kg CsA in the presence or absence of Q3GA. Intravenous injection of 2.5 mg/kg CsA was performed on the rats in the presence or absence of Q3GA. Values are expressed as the mean ± standard deviation (n=6). Q3GA-M, middle dose Q3GA (5 mg/kg). CsA, cyclosporin A; Q3GA, quercetin-3-O-β-D-glucoside.