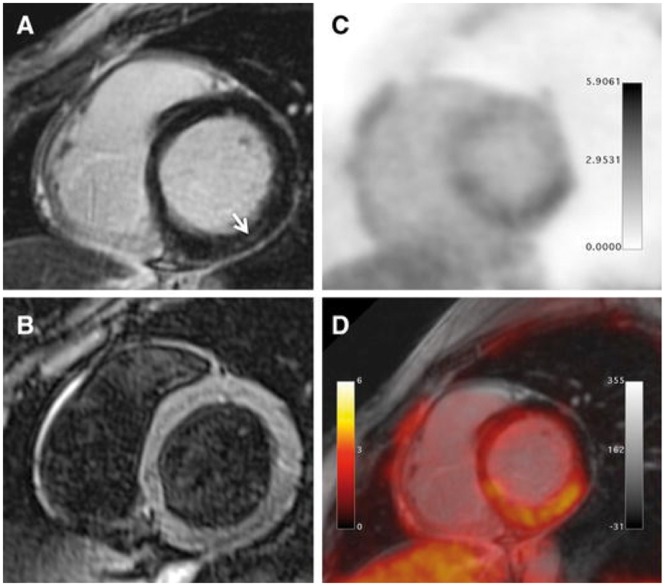
Figure 5.
PET-MR images in myocarditis. Inferolateral wall mid-wall fibrosis (MRI) (A), homogenous T2 signal intensity (MRI) (B). Increased 18F-FDG signal in the inferolateral wall (PET) (C). Fused PET-MR with increased 18F-FDG uptake at the site of inferolateral LGE (D). Reproduced with permission from ref. 80.

