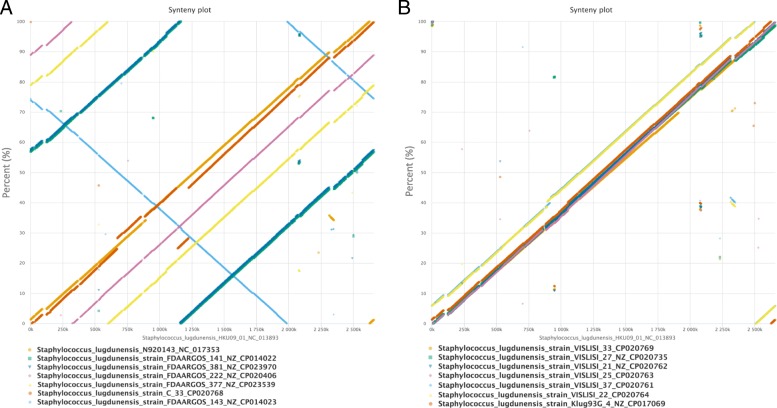
Fig. 3.
Structural genomic comparison of S. lugdunensis reference strain HKU0901 with the 14 other complete S. lugdunensis genomes. Synteny plots were produced by using EDGAR web server, showing the stop positions of orthologous gene pairs in different genomes. S. lugdunensis HKU09101 genome was compared with the 14 other genomes by splitting the analysis in two for better visual representation (panel a and b). Although some genomes have differing start positions, they all show a high degree of co-linearity, indicating a high level of relatedness and a low level of genomic rearrangement activity within the nalayzed set

