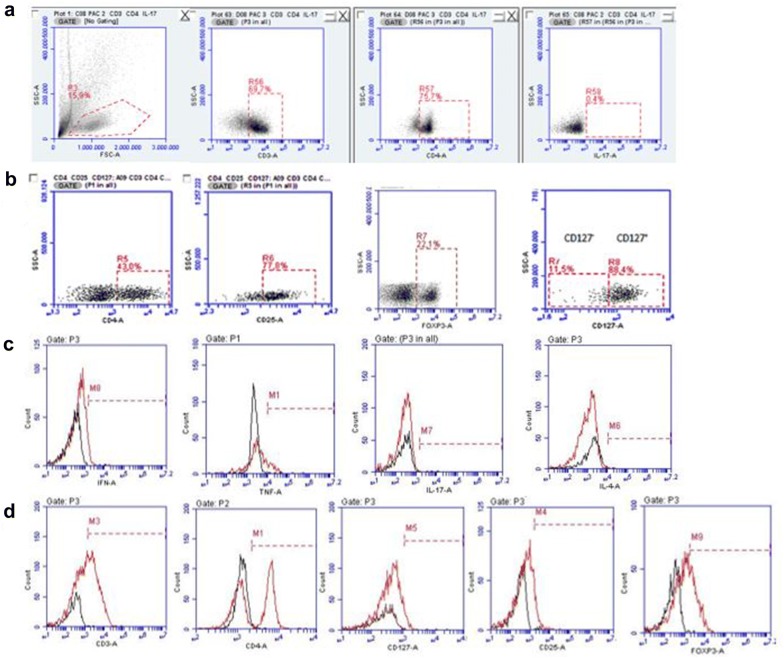
Fig. 2.
CD3+CD4+IL-17+, CD4+CD25+CD127+FOXP3+ and CD4+CD25+CD127−FOXP3+ cells analysis model used in flow cytometry. a Representative scheme of the analysis used to identify CD3+CD4+IL-17+ T cell sub-population through the identification of its cytokine and dot plots illustrate isotype control used to make the quadrants. b Representative scheme of the analysis used to identify Treg cell (CD4+CD25+CD127+FOXP3+) and activated Treg cells (CD4+CD25+CD127−FOXP3+). c, d Flow cytometry histograms show the isotype controls and cells with positive reactivity with human monoclonal antibodies. Black line shows the isotype control and red line shows cells

