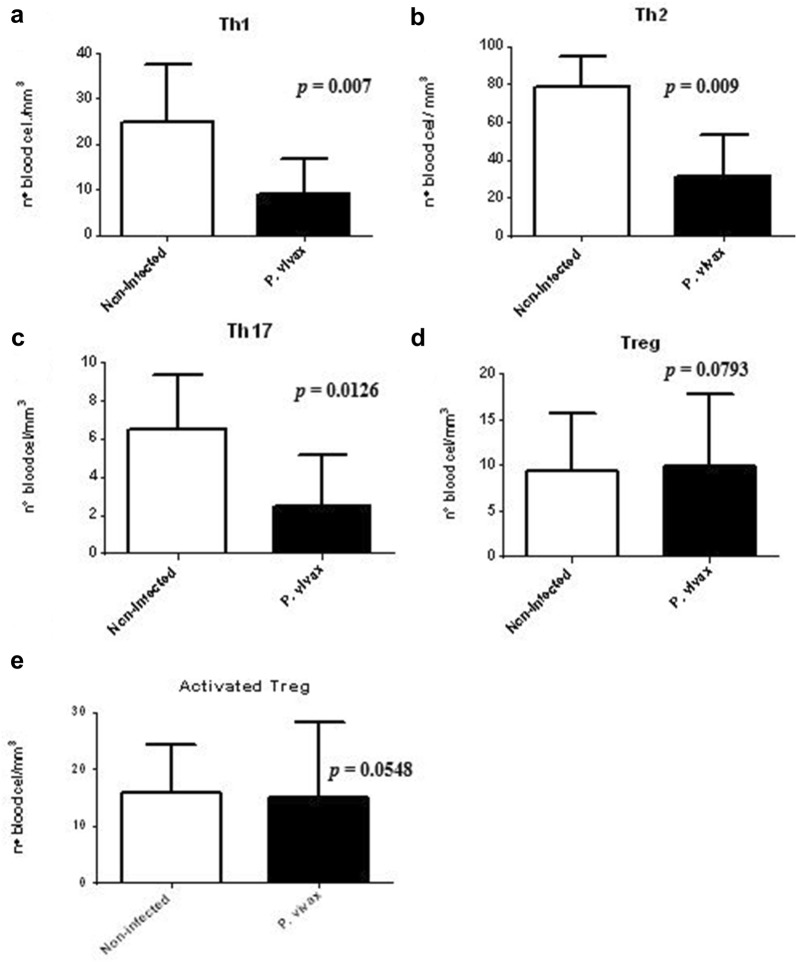
Fig. 3.
Analysis of the Th1, Th2, Th17, Treg and activated Treg cells profile. a Number of cells IFN-γ+/TNF-α+, b IL-4+, c IL-17+, d, e Tregs respectively, in the T cell sub-populations: Th1, Th2, Th17, Treg and activated Treg cells of patients infected with P. vivax (n = 50) and non-infected controls (n = 20). Mann–Whitney t test

