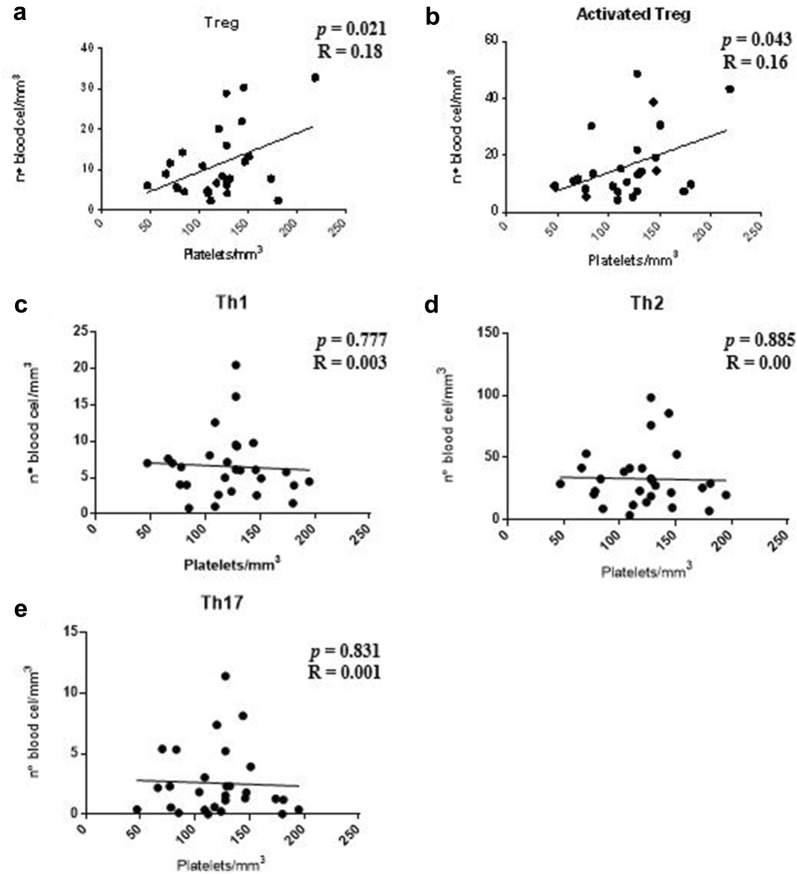
Fig. 7.
Correlation analysis between platelet counts and T lymphocyte sub-populations in patients with serum Th2 cytokine profile. a, b Presence of positive correlation between the number of platelets (mm3) and sub-populations of Treg cell and activated Treg cells. c–e Absence of correlation between the number of platelets (mm3) and the number of cells corresponding to the T cell sub-populations: Th1, Th2 and Th17 (n = 40). Spearman correlation coefficient test

