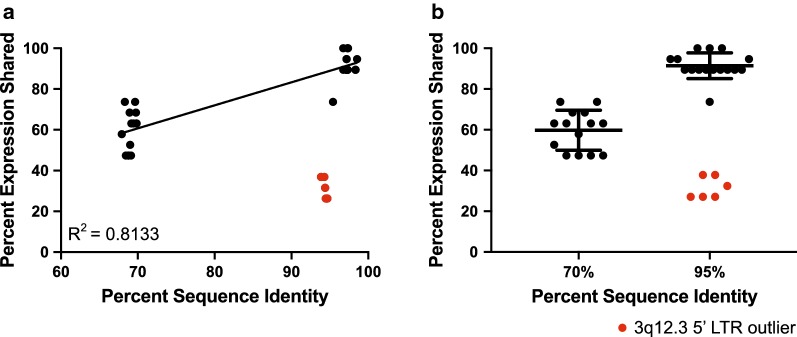
Fig. 2.
LTR sequence identity is correlated with promoter expression patterns, with the exception of 3q12.3. Scatter plots displaying the correlation between percent sequence identity and shared percent expression. Raw values are shown in Additional file 2 and are based on pairwise comparisons. Best fit line and its R2 value are shown for (a) (black values only). Error bars depict the mean ± standard deviation in (b) (black values only). Outlying 3q12.3 5′ LTR data points are shown in red for both plots

