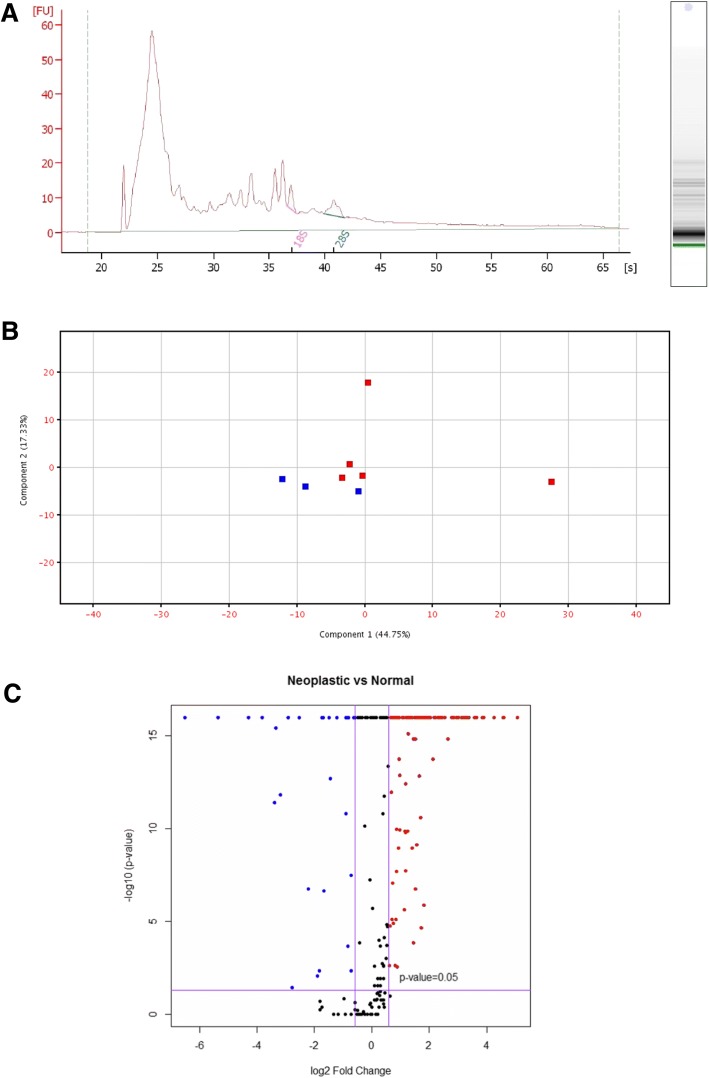
Fig. 2.
RNAseq profiling exosomal RNA. a RNA bioanalyzer fluorogram from CMT cell-free conditioned media showing a large proportion of the RNA is small in size (range likely to contain microRNAs). 18S and 28S markings denote location typical of rRNA peaks. b Principal Component Analysis (PCA) plot for microRNA profile by deep-sequencing comparing CMT (red) and CMEC (blue) group biological replicates. Distinct clustering between normal and neoplastic groups was observed. c Volcano plot showing up-regulated and down-regulated miRs. miRNAs in the upper right and upper left quadrants were statistically different between CMT and CMEC groups (p < 0.05). miRs identified in red were > 1.5-fold up-regulated in the CMT group relative to CMEC; miRs identified in blue were > 1.5-fold down-regulated in the CMT group relative to CMEC

