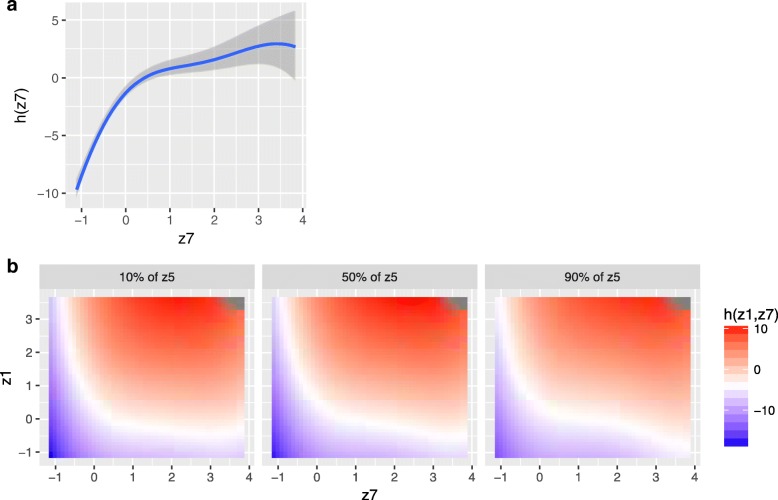
Fig. 2.
Cross-sections of the exposure-response function h(z1, …, z7), estimated using Bayesian kernel machine regression. a Univariate exposure-response function of z7 (95% credible intervals [CI]), where the remaining exposures are fixed at their median values. b Bivariate exposure-response function of z7 and z1 for z5 fixed at either its 10th, 50th, or 90th percentile, and for the remaining exposures fixed at their median values

