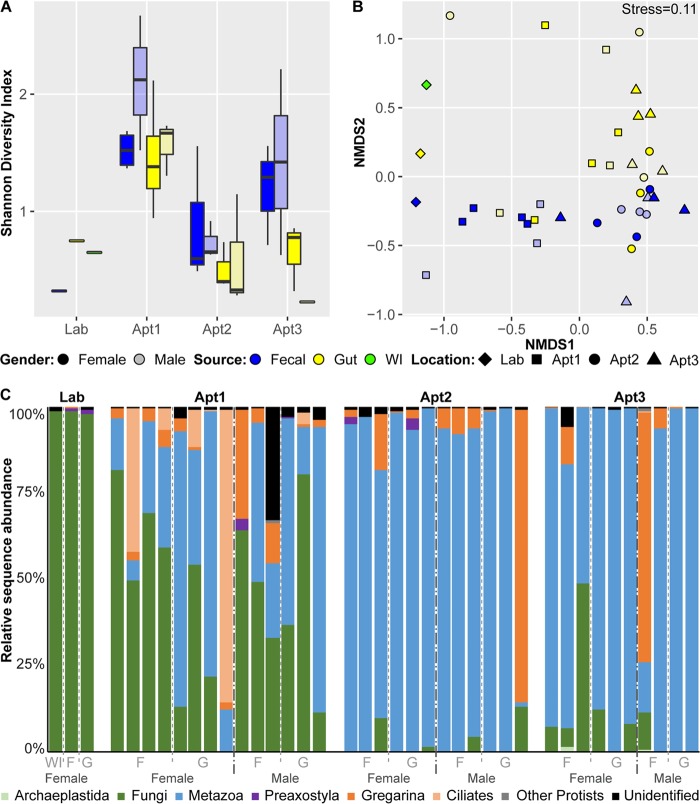
FIG 8.
The eukaryotic component of the cockroach microbiome among female and male whole-insect, whole-gut, and fecal samples of B. germanica by location. WI, whole insect; F, feces; G, gut. (a) Alpha-diversity boxplots using the Shannon index. For each group, the bars delineate the median, the hinges represent the lower and upper quartiles, the whiskers extend to the most extreme values (no more than 1.5 times the interquartile range from the box), and outliers are plotted in circles, if present. (b) Nonmetric multidimensional scaling (NMDS) using the Bray-Curtis dissimilarity. (c) Relative abundances of eukaryotic taxa.

