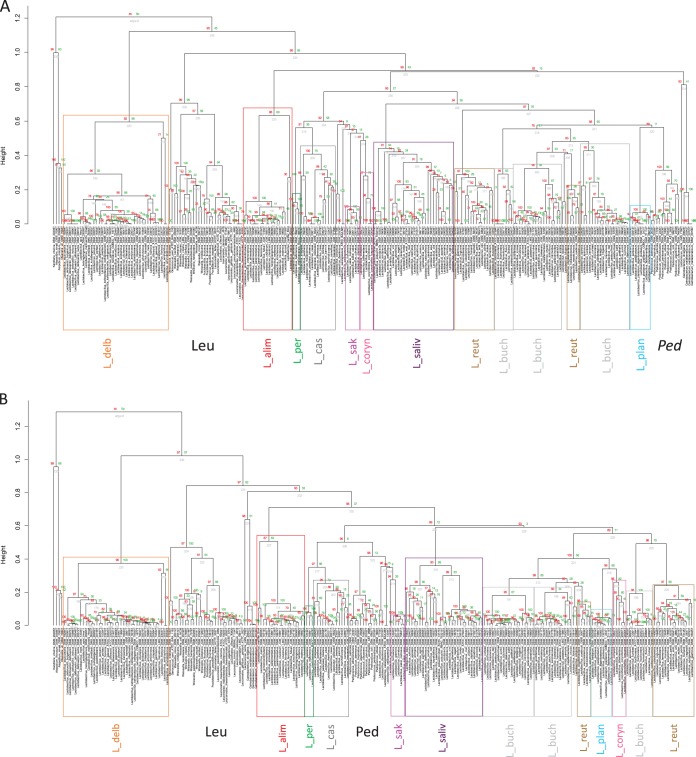
FIG 2.
Dendrograms depicting the genome relatedness based on the average amino acid identity (AAI) (A) and the percentage of conserved protein (POCP) (B) calculations. Colors refer to the same phylogroups indicated in Fig. 1. L_delb, L. delbrueckii group; L_alim, L. alimentarius group; L_per, L. perolens group; L_cas, L. casei group; L_sak, L. sakei group; L_coryn, L. coryniformis group; L_saliv, L. salivarius group; L_reut, L. reuteri group; L_buch, L. buchneri group; L_plan, L. plantarum group; Leu, Leuconostocaceae; Ped, Pediococcus. Statistics and visualization were carried out in R (v3.1.1) (https://www.r-project.org/), using the pvclust package (49). Red numbers are unbiased P values, green numbers are bootstrap probabilities, and gray numbers are node numbers.

