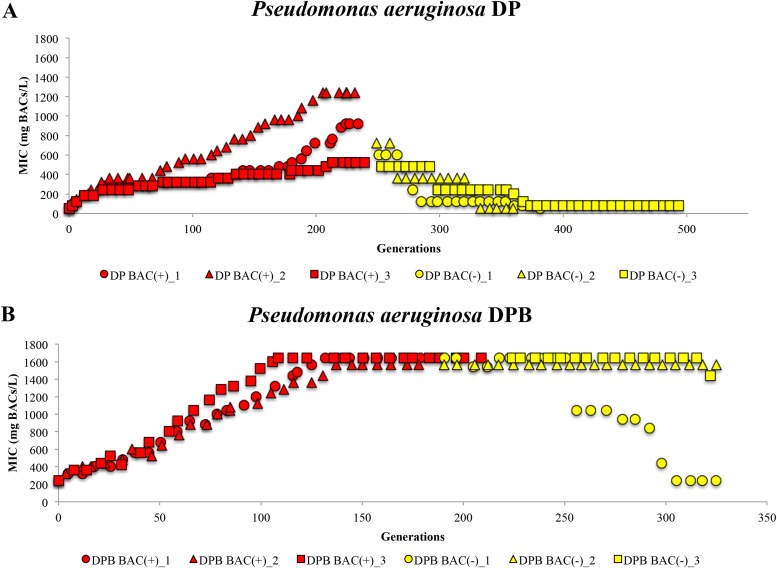
FIG 2.
Changes in MICs of BAC during an adaptive evolution experiment with P. aeruginosa DP (A) and P. aeruginosa DPB (B). The adaptive evolution experiment consisted of two phases: BAC exposure, where BAC concentration was increased after each round until reaching the maximum concentration in which growth was observed (red dots; each dot represents a passage), and BAC free (yellow dots). The MIC for BAC (y axis) was measured during each round of growth, for approximately 320 to 500 generations. The x axis shows the number of generations since the start of the experiment.

