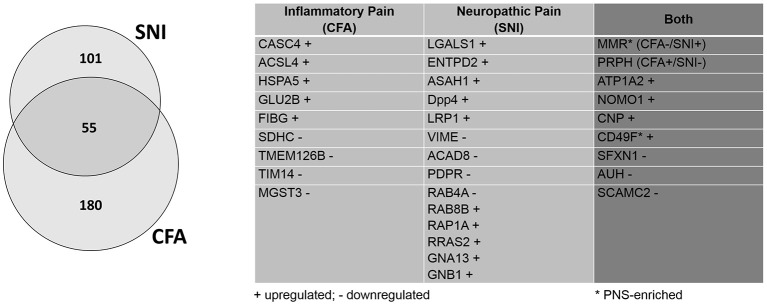
Figure 5.
Retrospective analysis of DRG membrane proteome dynamics in two chronic pain models. Application of our pan-mouse library for retrospective analysis of our recently published datasets on mean abundance changes of DRG membrane proteins in the SNI-model of neuropathic pain and the CFA-model of inflammatory pain (Rouwette et al., 2016). Venn diagram illustrates the proportions of significantly regulated (across all three replicates; Benjamini-Hochberg-corrected p-value, q < 0.05) DRG membrane proteins. The table lists examples of regulated (+, upregulated; -, downregulated) candidates across both pain models (complete list: Supplementary Table 10).

