
Figure 7.
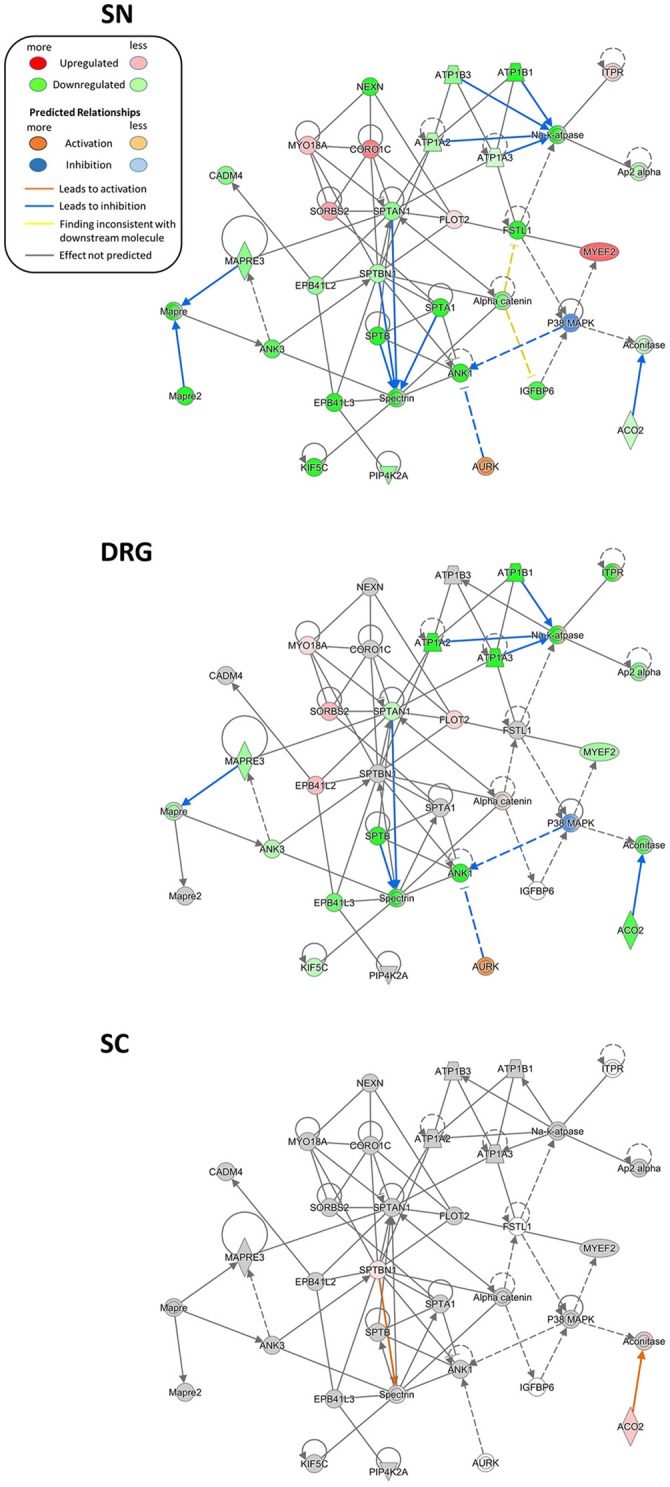
Region-resolved changes in the FSTL1-NKA-protein network upon SNI. Differential regulation of mean protein abundance across SN, DRG, and SC becomes apparent and is visualized by a graded color code. Node color code: red, upregulated; green, downregulated; gray, unchanged; white, not detected. Moreover, causal network analysis predicts differences in activation (line color orange) and inhibition (line color blue) of distinct connections between members of this network. Predicted relationship among nodes is indicated by dashed lines. All graphs are created by IPA®. Up-and downregulation refer to proteins that were significantly regulated across all three replicates (Benjamini-Hochberg-corrected p-value, q < 0.05) upon SNI.