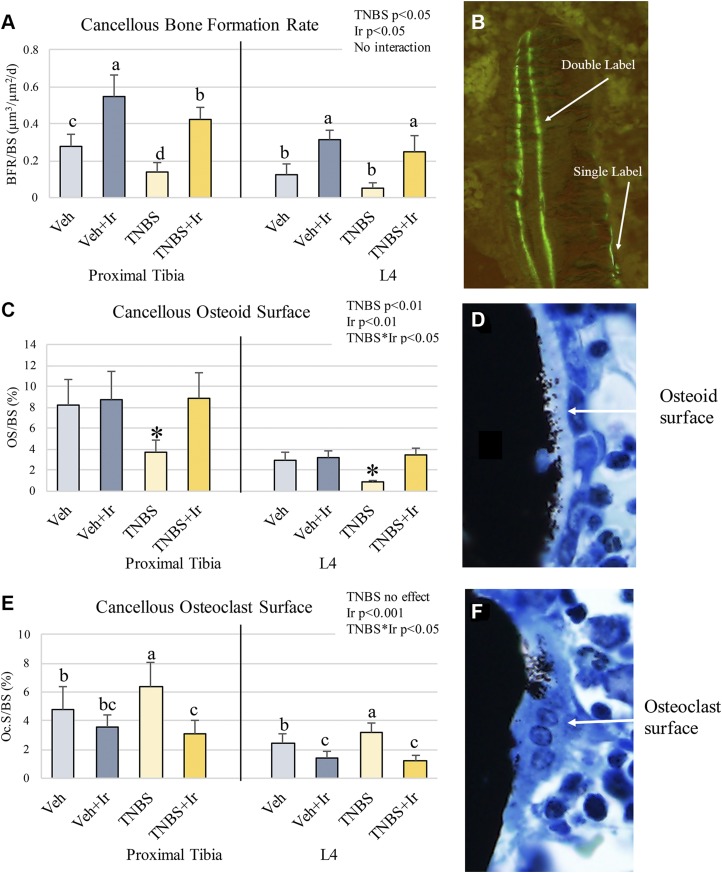
Figure 5.
Bone histomorphometry. A) Cancellous BFR at the proximal tibia and L4 were depressed due to TNBS and elevated due to irisin treatment. B) Representative image of single- vs. double-labeled fluorochrome in cancellous bone. D) Representative image of osteoid surface. E) Osteoclast surface was increased in TNBS but decreased due to irisin. F) Representative image of osteoclast surface. *P < 0.05. Bars not sharing the same letter (a, b, c) are statistically different from each other (A, E). Error bars indicate sd.

