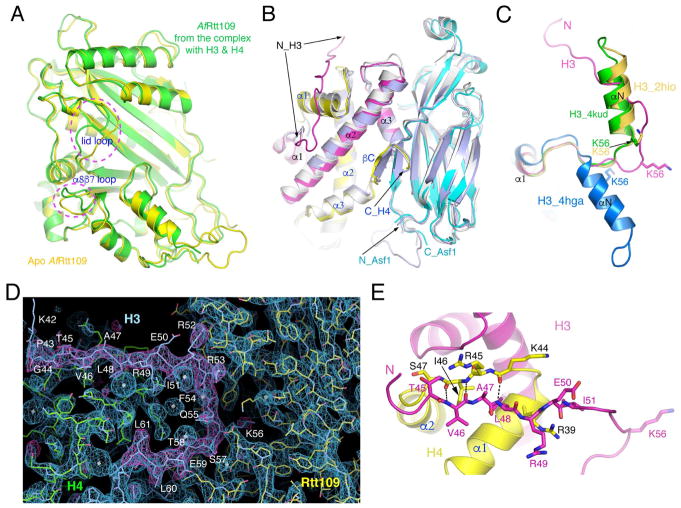
Figure 3. Structural changes of Rtt109 and histones.
(A) Comparison of AfRtt019 structures between the apo and substrate-bound forms. Two regions of conspicuous differences, the “lid” and the α8β7 loops are indicated. (B) Superposition of Asf1-H3-H4 structures. The AfAsf1 complex is colored the same as before, and the yeast (PDB id: 2HUE) and human (PDB id: 2IO5) complexes are colored light blue and white, respectively. (C) Conformational differences of the N-terminal region of H3 in the structures of the AfRtt109 complex (magenta), NCP (PDB id: 4KUD, green), histone octamer (PDB id: 2HIO, goldenrod) and the DAXX complex (PDB id: 4HGA, blue). (D) Superposition of 2Fo-Fc (blue, 1.5σ) and Fo-Fc (magenta, 3σ) omit electron density maps calculated from leaving out residues 43–61 of histone H3. (E) Interactions between residues 45–51 of histone H3 (magenta) and the α1-α2 region of histone H4 (yellow) in the Rtt109-Asf1-H3-H4 complex. The involved residues are shown in a stick representation. The dashed lines indicate hydrogen bonds.

