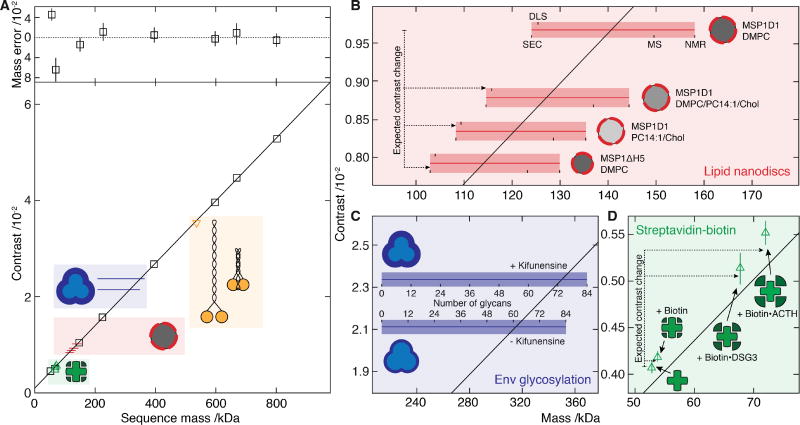
Fig. 2. Characterization of iSCAMS accuracy, precision, and dependence on molecular shape and identity.
(A) Contrast vs molecular mass including proteins used for mass calibration (black), and characterization of shape dependence (yellow), protein-ligand binding (green), lipid nanodisc composition (red) and glycosylation (blue). Mass error (upper panel) is given as a percentage of the sequence mass relative to the given linear fit. (B) Nanodisc mass-measurement for different lipid compositions and protein belts. Masses obtained by alternative methodologies for MSP1D1/DMPC are marked and extrapolated to the other compositions. The horizontal bars indicate the expected mass range as a function of characterization technique, with the thin bar indicating the contrast measured, and the thick bar representative of the measurement uncertainty in terms of the standard error of the mean for repeated experiments. For each sample, the upper text denotes the membrane scaffold protein (MSP) used, and the lower the lipids in the nanodisc. (C) Recorded differential contrast for Env expressed in the presence or absence of kifunensine, and associated mass ranges expected for different glycosylation levels as defined for C. (D) Mass-sensitive detection of ligand binding using the biotin-streptavidin system according to the sequence mass of streptavidin and the masses of biotin and two biotinylated peptides relative to the calibration obtained from A. Abbreviations used are summarized in Supplementary Table S8.

