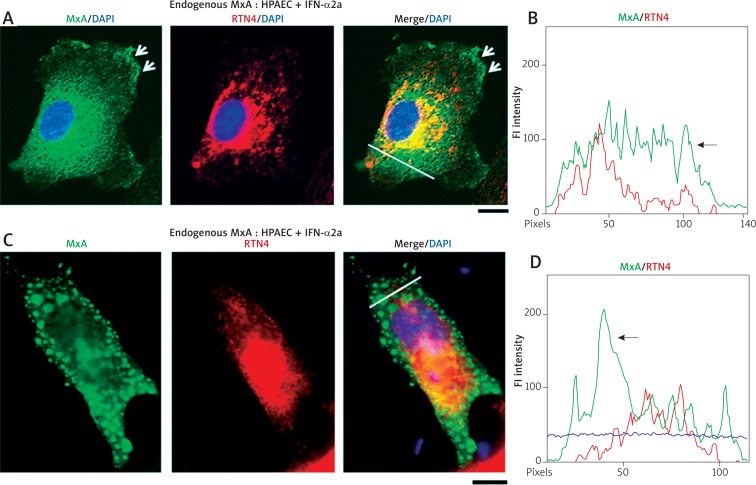
Fig. 4.
IFN-α-induced endogenous MxA in HPAECs was also at the plasma membrane and in larger globular structures. Panels A and C show IFN-treated HPAEC cells from the experiment in Fig. 3 which showed the induced endogenous MxA at the plasma membrane (arrows in Panel A) and in a fine reticular meshwork in the cytoplasm. The latter was distinct from the RTN4-ER (arrow in the line scan in Panel B). Panels C and D show an IFN-α-treated HPAEC cell with MxA in globular structures throughout the cytoplasm which are RTN4-negative. The line scan in Panel D confirms the distinctness of the MxA structures (arrow in line scan in Panel D). Scale bars = 10 μm. R values correspond to the Pearson’s correlation coefficients (after automatic Costes’ thresholding)

