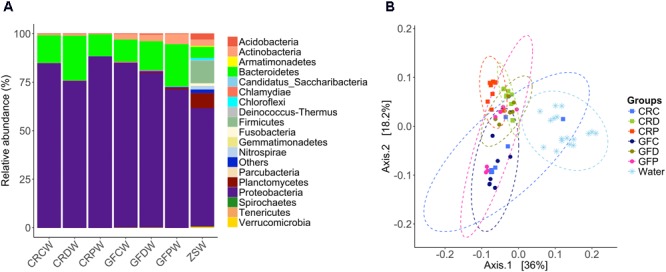
FIGURE 7.

Relative abundance of bacterial phyla in the water samples (A) and principal coordinate analysis plot (B). The PCoA plot based on weighted UniFrac distance metric shows the distinction between the bacterial communities in water and zebrafish intestine. Ellipses include 95% of samples from normally distributed data. CRCW, CRDW, and CRPW represent the water samples collected from their respective flasks/tanks on day 2, 3, 7, and 14. GFCW, GFDW, and GFPW represent the water samples collected only on day 14. ZSW represents the water samples collected from the zebrafish facility on days 7 and 14.
