. 2017 Aug 17;8(10):7014–7024. doi: 10.1039/c7sc01054k

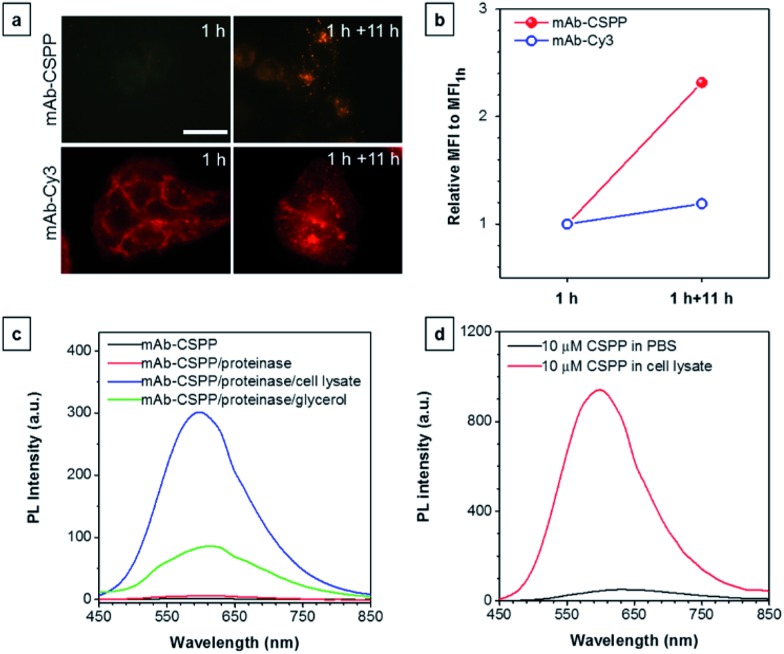
Fig. 7. (a) Fluorescence images of HCC827 cells incubated with 10 μg mL–1 of mAb–CSPP and mAb–Cy3 conjugates for 1 h and the fluorescence images of dye-stained cells following washing with PBS and further incubation in a fresh medium for 11 h. Conditions: for mAb–Cy3, λex = 510–550 nm, dichroic mirror = 570 nm. For mAb–CSPP, λex = 400–440 nm, dichroic mirror = 455 nm. Exposure time: 2 s. Scale bar: 30 μm. (b) Flow cytometric analysis of HCC827 cells after incubation with mAb–CSPP and mAb–Cy3 conjugates for 1 h, followed by incubation in a fresh medium without the antibody probe for 11 h. The plot shows the relative fluorescence intensity (MFI/MFI1 h), where MFI1 h is the mean fluorescence intensity after probe incubation for 1 h. Conditions: for mAb–Cy3, λex = 561 nm, detection with bandpass filter = 583 ± 7.5 nm. For mAb–CSPP, λex = 405 nm, detection with bandpass filter = 610 ± 10 nm. (c) The PL intensity change of the digested mAb–CSPP conjugates catalyzed by Proteinase K upon addition of cell lysate and 50% glycerol. The concentration of mAb–CSPP used for the fluorescence measurement was 0.2 mg mL–1. (d) The PL intensity change of 10 μM of CSPP induced by cell lysate.

Fig. 7