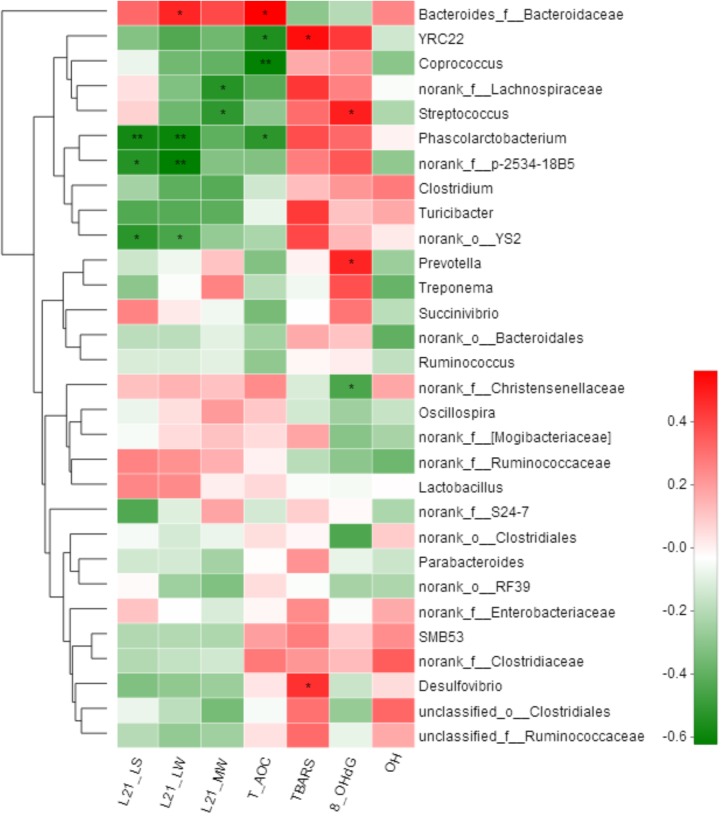
FIGURE 5.
Correlation analysis between relative abundance (%) of fecal microbiota with litter performance and serum oxidative stress levels of sows. Correlation analyses were performed on differential values for each sow in both groups (H group and L group during gestation). L21_LS: litter size on day 21 of lactation; L21_LW: litter weight on day 21 of lactation; L21_MW: mean weight of piglet on day 21 of lactation; TBARS: thiobarbituric acid reactive substances; 8-OHdG: 8-hydroxy-deoxyguanosine; T-AOC: total antioxidant capacity; -OH: hydroxy radical scavenging capacity. ∗P < 0.05; ∗∗P < 0.01. (following the Spearman correlation analysis).

