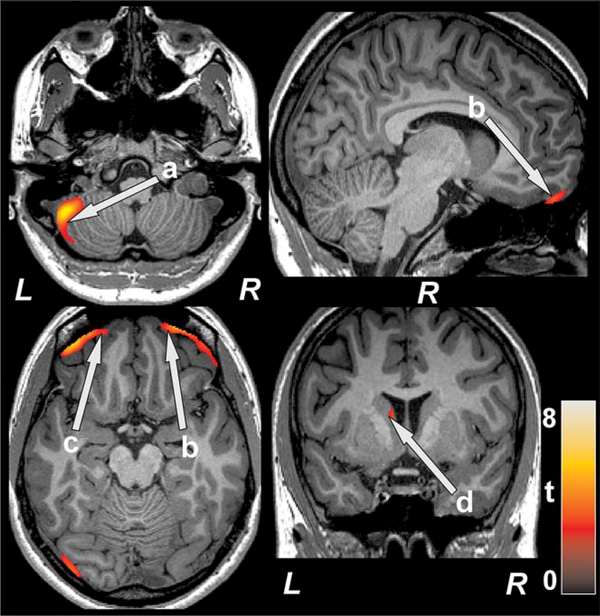
FIGURE 4.
Brain regions with decreased T2-relaxation values in SVHD over controls. Decreased T2-relaxation values, indicated altered tissue integrity, were observed in left cerebellar cortex (a), bilateral prefrontal cortices (b, c), and left caudate (d). Figure conventions are same as in fig. 2

