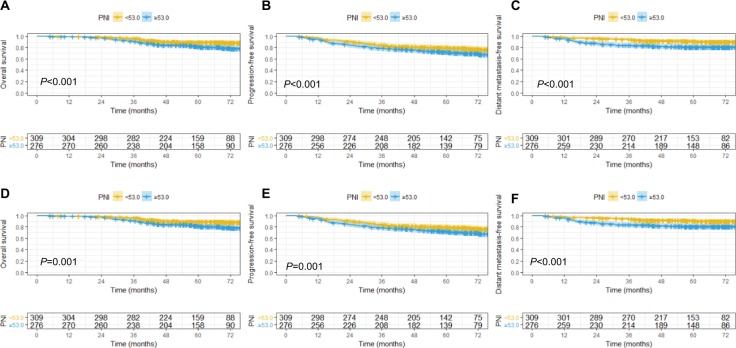
Figure 3.
Kaplan–Meier survival curves of OS, PFS, and DMFS classified into two groups according to SII before (A–C) and after (D–F) PSM. Log-rank test, P < 0.05.
Abbreviations: DMFS, distant metastasis–free survival; OS, overall survival; PFS, progression–free survival; PSM, propensity score matching; SII, systemic immune-inflammation index.

