
Figure 3.
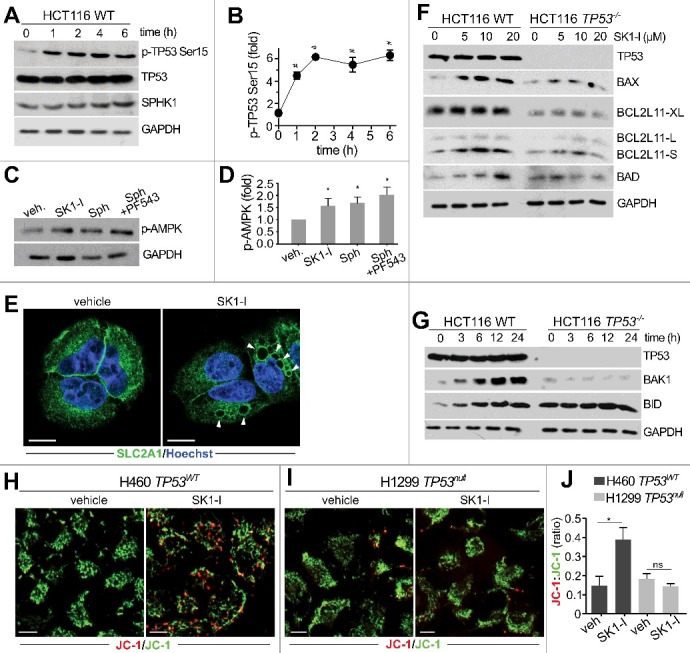
SK1-I increases TP53 phosphorylation and activation of BCL2-related pro-apoptotic proteins. Wild-type TP53 HCT116 cells (A,C,F,G) and TP53−/− HCT116 cells (F,G) were treated with 10 µM SK1-I for the indicated times (A,G), or with the indicated concentrations of SK1-I for 12 h (F), or for 5 h with 10 µM SK1-I (C), 10 µM sphingosine (C), or pre-treated with 1 µM PF543 for 30 min followed by10 µM SK1-I (C). Cell lysates were analyzed by immunoblotting with the indicated antibodies. (B,D) Densitometric quantification of phospho-TP53 (Ser15) shown in panel A (n = 4), or phospho-AMPK in panel C (n = 3). (E) Confocal images of H460 cells treated with vehicle or with 10 µM SK1-I for 4 h and immunostained with anti-SLC2A1/GLUT1. Nuclei were labeled with Hoechst. (H-I) Confocal live cell images (H,I) and accompanying red:green fluorescence quantification (J) of TP53 wild-type H460 (H) and TP53 null H1299 (I) cells labeled with JC-1 dye following treatment for 8 h without or with 7.5 µM SK1-I. n = 6. Data are mean ± SEM. ns, not significant. *p ≤ 0.05; #p ≤ 0.0005.