
Figure 5.
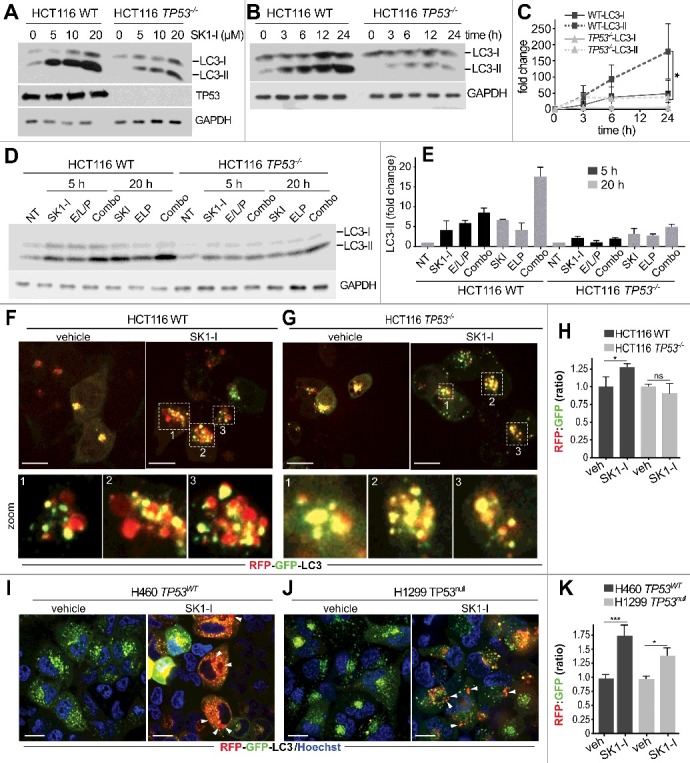
SK1-I increases LC3 processing in a TP53-dependent manner. (A-E) Wild-type HCT116 cells and TP53−/− HCT116 cells were treated with the indicated SK1-I concentrations for 12 h (A), with 10 µM SK1-I for the indicated times (B), or with the indicated treatments and times (D); E/L/P was 10 µM E64d, 1 µg/ml leupeptin, 10 µg/ml pepstatin A, and 10 µM SK1-I. For combo, cells were pretreated with E/L/P for 30 min followed by SK1-I. Cell lysates were immunoblotted with the indicated antibodies. (C,E) Densitometric analysis of LC3-I and LC3-II shown in panels (B) and (D), respectively. n = 3. Note: no time-dependent changes in LC3-II were observed after treatment with vehicle in (D). (F-K) Confocal images of wild-type HCT116 (F), TP53−/- HCT116 (G), H460 cells with wild-type TP53 (I), or H1299 TP53 null cells (J) expressing RFP-GFP-LC3 treated with a vehicle or 7.5 µM SK1-I for 7 h (F,G) or 18 h (I, J), and RFP:GFP fluorescence ratio determined (H, K). n = 4. Data are means ± S.E.M. ns, not significant. *p ≤ 0.05; ***P≤0.001. Scale bars: 10 µm. In panels (D, E), zoom boxes outline LC3 puncta that were distinctly red, yellow, and/or green.