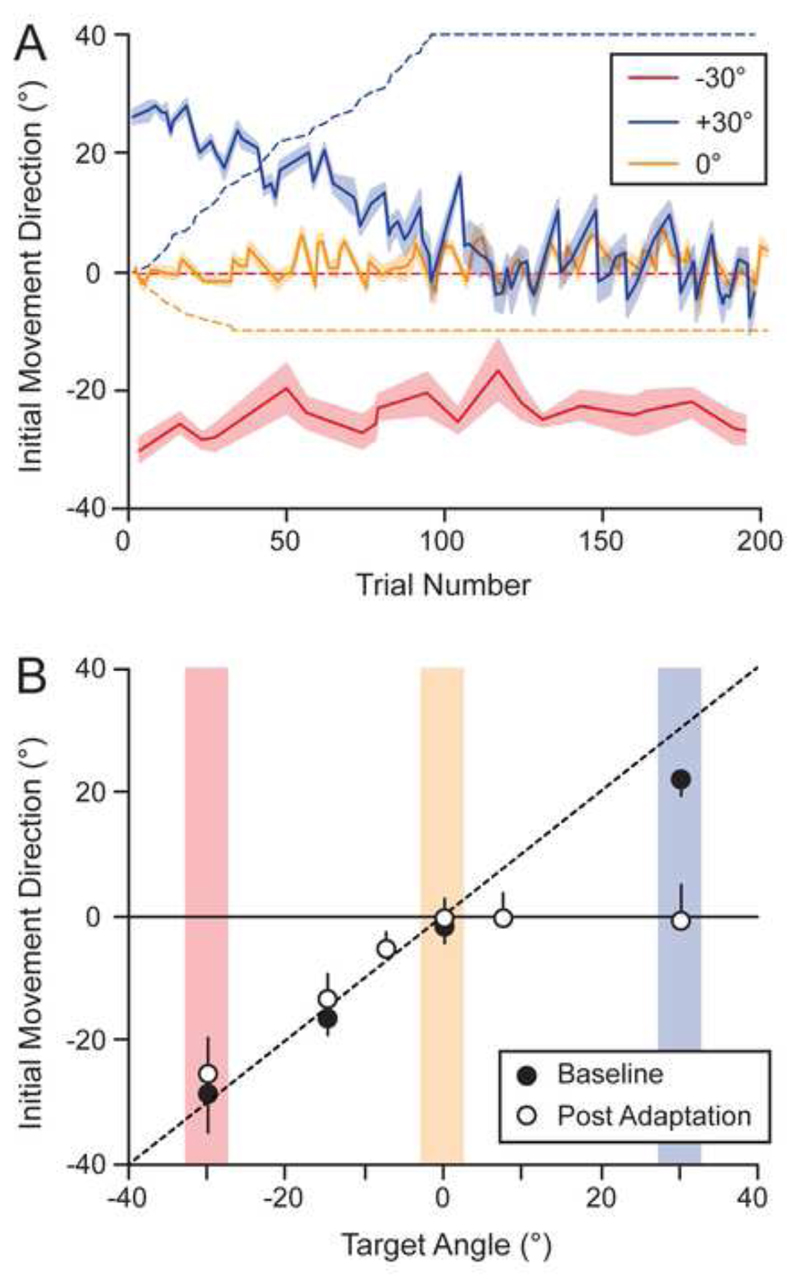
Figure 2. Initial movement directions during and after visuomotor adaptation.
(A) Direction of the robot handle, relative to the start position, at 30% of the distance to the targets as a function of trial number during the adaptation phase. The red, orange and blue lines represent one-target trials involving the -30, 0, and +30° targets, respectively. Each line represents the mean across participants and the shaded region represents ±1 SE. The colour-matched dashed lines show the visuomotor rotations applied to each target. Note that the +40° and -10° rotations were increased linearly over each trial of the +30° and 0°, respectively, and the rotations applied appear jagged in the plot due to the spacing of these trials among the other trials (B) Average initial movement direction for one-target trials (based on participant medians) as a function of target angle during baseline testing on Day 1 (black circles) and after adaptation on Day 2 (white circles). The dashed line is the unity line and the vertical black lines represent either plus or minus 1 SD.

