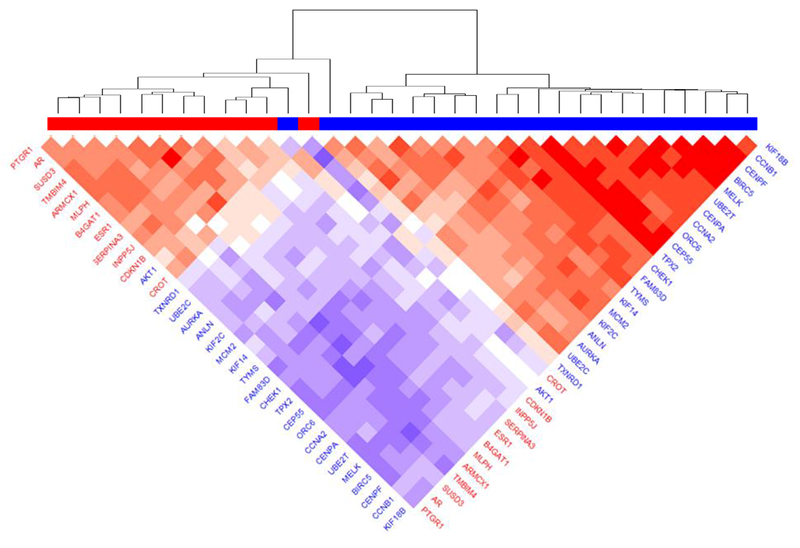
Fig. 3.

Co-expression of miR-500a-related genes with strongest association with survival, according to LIBCSP results. Blue color in gene labels and horizontal bar indicates genes associated with worse survival, red color associated with better survival. Color of the plot cells shows the correlation in respective pair of genes (red color indicating positive correlation and blue color – negative correlation).
