
FIGURE 1.
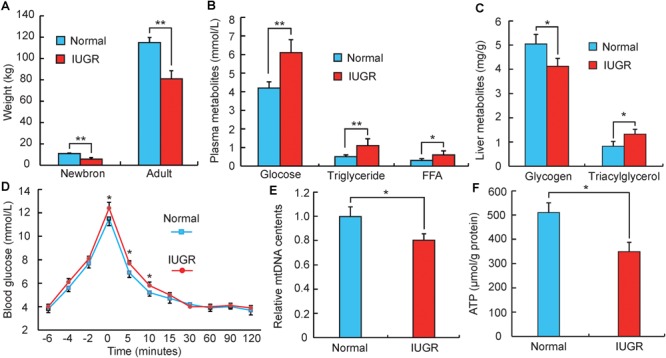
Phenotypic differences between adult normal and IUGR pigs. (A) The body weights of normal and IUGR pigs as newborns and adults (n = 8). (B) The blood glucose, triglyceride and free fatty acid (FFA) concentrations in adult normal and IUGR pigs (n = 8). (C) The contents of glycogen and triglyceride in livers of adult normal and IUGR pigs (n = 8). (D) Plasma glucose concentrations after an intravenous glucose tolerance test (i.v.GTT) at 149 days of age. Time indicates minutes relative to the completion of dextrose infusion (n = 8). (E) The copy number of hepatic mitochondrial DNA in adult normal and IUGR pigs (n = 8). (F) The contents of ATP in livers of adult normal and IUGR pigs (n = 8). Data are means ± SD. Statistical significance was calculated by Student’s t-test (n = 8 per individual). Significant differences levels: ∗p < 0.05, ∗∗p < 0.01.