
FIGURE 2.
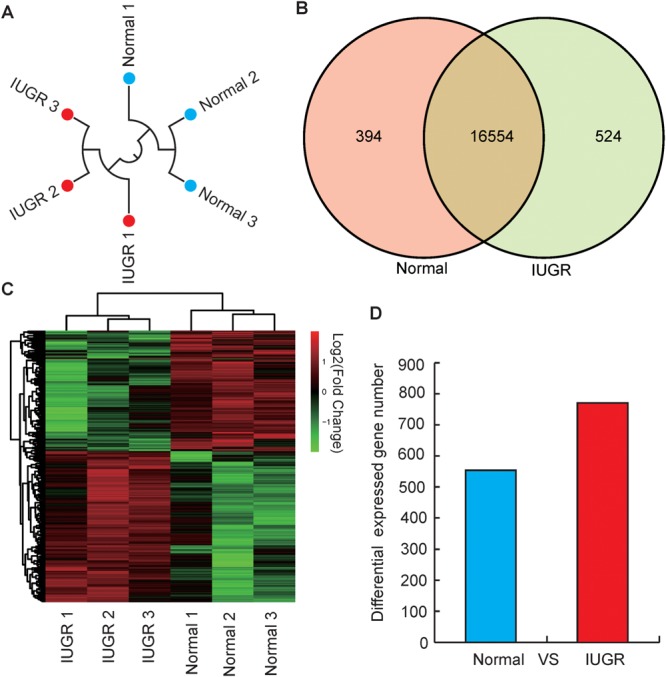
Genome-wide distribution of DGEs between normal and IUGR pigs. (A) Hierarchical clustering of samples using all expressed genes for biological reproducibility analysis. (B) Venn diagram of expressed genes between normal and IUGR pigs. (C) Heat map diagram of DGEs between normal and IUGR pigs (D) Distribution of DEGs between normal and IUGR pigs.