
FIGURE 4.
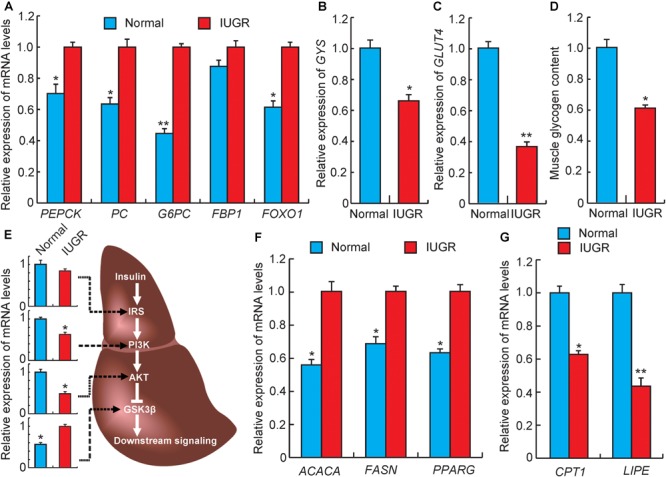
Gene expression related to glucose and lipid metabolism. (A) The expression levels of gluconeogenesis rate-limiting enzymes genes in livers. PEPCK, phosphoenolpyruvate carboxykinase; PC, pyruvate carboxylase; G6PC, glucose-6-phosphatase; FBP1, fructose-1,6-bisphosphatase 1; FOXO1, forkhead box O1. (B) The expression levels of glycogen synthesis gene (GYS) in livers. (C) The expression levels of glucose transporter gene (GLUT4) in muscles. (D) The glycogen levels in muscles. (E) The expression levels of genes related to insulin signaling in livers. IRS, insulin receptor substrate; PI3K, phosphatidylinositol 3-kinase; AKT, serine/threonine protein kinases; GSK3β, glycogen synthase kinase 3 beta. (F) The expression levels of fatty acid synthesis genes in livers. ACACA, acetyl-CoA carboxylase alpha; FASN, fatty acid synthase. (G) The expression levels of fatty acid oxidation genes in livers. CPT1, diacylglycerol cholinephosphotransferase; LIPE, lipase, hormone sensitive; PPARG, peroxisome proliferator activated receptor gamma. Data are means ± SD. Statistical significance was calculated by one-way repeated-measures analysis of variance (n = 3 per individual). ∗p < 0.05, ∗∗p < 0.01.