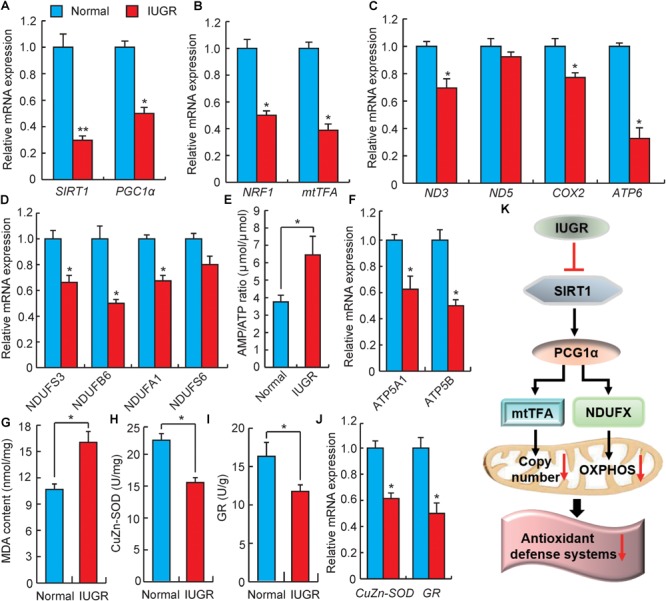
FIGURE 5.

Analysis of genes involved in mitochondrial biogenesis and energy metabolism. (A) DEGs involved in energy homeostasis. SIRT1, sirtuin 1; PGC1α, PPAR coactivator 1 alpha. (B) Expression levels of mitochondrial biogenesis related genes. NRF1, nuclear respiratory factor 1; mtTFA, transcription factor A, mitochondrial. (C) The relative expression levels of mitochondrial genomic genes. ND3, NADH dehydrogenase subunit 3; ND5, NADH dehydrogenase subunit 5; COX2, cytochrome c oxidase subunit II; ATP6, ATP synthase F0 subunit 6. (D) The expression levels of genes associated with the electron transport chain. NDUF, NADH:ubiquinone oxidoreductase subunit. (E) The ratio of AMP/ATP in livers. (F) The expression levels of ATP synthesis genes. ATP5A1, ATP synthase, H+ transporting, mitochondrial F1 complex, alpha subunit 1; ATP5B, ATP synthase, H+ transporting, mitochondrial F1 complex, beta polypeptide. (G) The contents of malondialdehyde (MDA) in livers. (H) The activity of CuZn-SOD in livers. (I) The activity of GR in livers. (J) The relative expressions of CuZn-SOD and GR genes. CuZn-SOD, Superoxide dismutase 1; GR, glutathione reductase. (K) Possible pathways of IUGR mediation of hepatic energy metabolism and oxidative stress in adulthood. Data are means ± SD. Statistical significance was calculated by one-way repeated-measures analysis of variance (n = 3 per individual). ∗p < 0.05, ∗∗p < 0.01.
