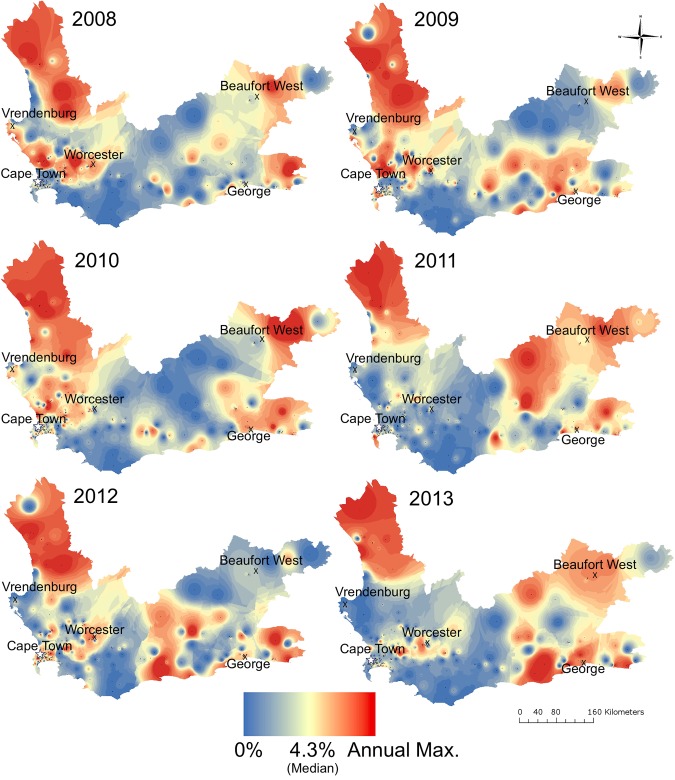
Fig 4. The percentage of total clinic-diagnosed tuberculosis cases found to be rifampicin resistant in Western Cape Province, yearly, for 2008–2013.
Each year has an associated spectrum of interpolated percentages, beginning with the percentage of total clinic-diagnosed tuberculosis cases found to be RR-tuberculosis equal to 0 set at blue, with a median value of 4.3% (provincial average) at yellow, and the year-specific maximum (Max.) percentage in red. X’s denote large towns and the star denotes the Cape Town metropole. Max., year-specific maximum; RR, rifampicin-resistant.

