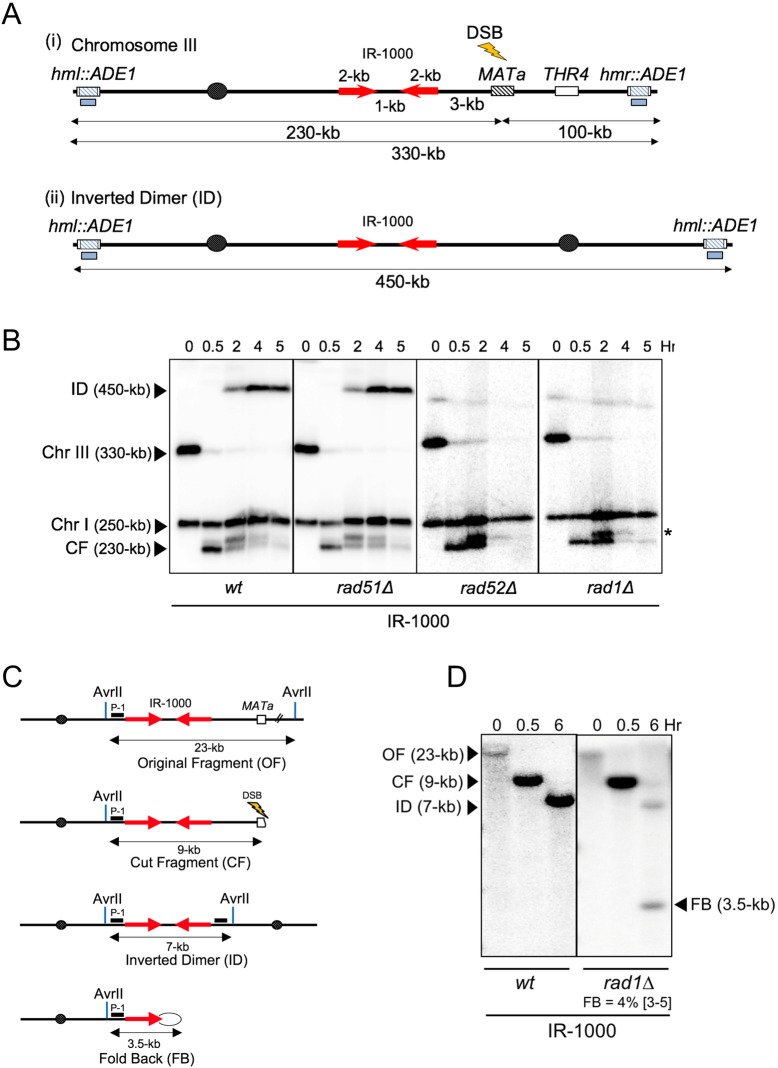
Fig 2. SSA between IRs separated by 1-kb spacer.
(A) Experimental system to study SSA between IRs. (i) Two 2-kb long IRs separated by 1-kb long spacer (IR-1000) were inserted into Chromosome III (Chr III), centromere proximal to MATa where DSB was induced by galactose-inducible HO endonuclease. (ii) The structure of Inverted dicentric dimer (ID) resulting from SSA between IRs located on the two different sister chromatids, as demonstrated in Fig 1v-a. Blue boxes under the chromosomes indicate the locations of the ADE1-specific probe on Chr III. (B) DSB repair analysis using CHEF gel electrophoresis of DNA isolated from wt (RAD1), rad51Δ, rad52Δ, and rad1Δ strains before (0 hour (Hr)), as well as 0.5, 2, 4, and 5 hours following DSB induction. The full-length Chr III, ID, cut fragment (CF) of Chr III generated by HO-induced DSB, and intact Chr I were detected by hybridization with ADE1-specific probe, and DNA fragment sizes are indicated in parenthesis. Asterisks indicate the shifted cut-fragment bands following DSB resection as described in [17, 86]. (C) The structure of original AvrII restriction fragments (OF) of chromosome III in IR-1000 strain (2-kb-long IRs separated by 1-kb-long spacer) and its derivatives following DSB: CF, ID, and FB. The location of hybridization probe P-1, specific to RBK1 sequence is indicated by black box. (D) Southern blot analysis of DSB repair in IR-1000 wt strain and its rad1Δ derivative following hybridization to probe P-1. The positions and corresponding sizes of OF, CF, ID and FB following AvrII restriction digestion of DNA isolated before (0-hr), as well as 0.5 and 6 hours following DSB induction are indicated. The median efficiency of FB formation (%) and the range of the median [in brackets] are indicated (see S1 Fig and Materials and Methods for details). Every gel was run with appropriate molecular-size markers that allowed to estimate the sizes of every band shown in each figure.

