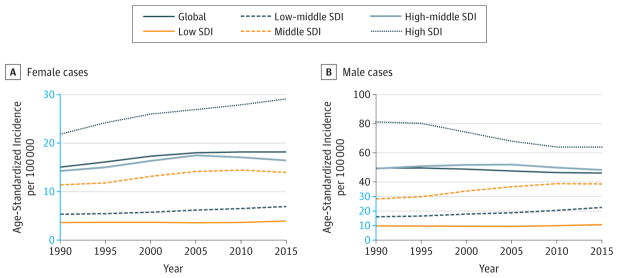
Figure 8. Trends in Age-Standardized Incidence Rates for Tracheal, Bronchus, and Lung Cancer, 1990–2015.
The y-axes differ in scale between male and female graphs to reflect differing incidence rates between sexes. The colored section of the higher-scale y-axis represents the entirety of the lower-scale y-axis.

